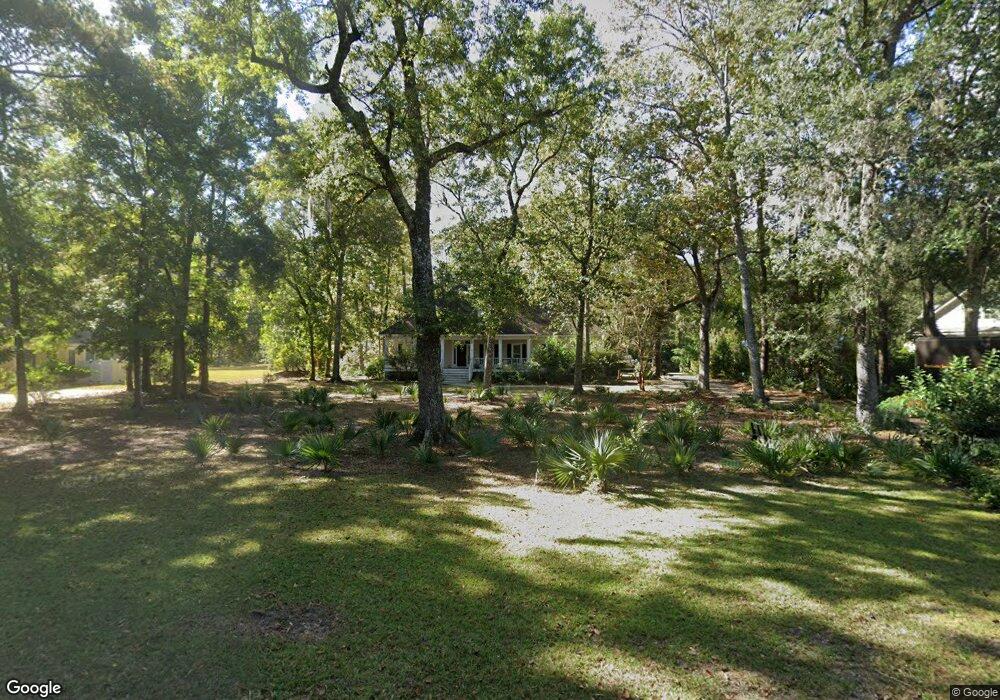
196 Old Carriage Loop Georgetown, SC 29440
Estimated Value: $1,156,000 - $1,508,000
4
Beds
4
Baths
2,727
Sq Ft
$471/Sq Ft
Est. Value
About This Home
This home is located at 196 Old Carriage Loop, Georgetown, SC 29440 and is currently estimated at $1,283,388, approximately $470 per square foot. 196 Old Carriage Loop is a home located in Georgetown County with nearby schools including Waccamaw Elementary School, Waccamaw Intermediate School, and Waccamaw Middle School.
Ownership History
Date
Name
Owned For
Owner Type
Purchase Details
Closed on
Mar 2, 2012
Sold by
First Palmetto Savings Bank Fsb
Bought by
Royster James F and Royster Catherine H
Current Estimated Value
Purchase Details
Closed on
Oct 10, 2011
Sold by
Moore Josephine B
Bought by
First Palmetto Savings Bank F S B
Purchase Details
Closed on
Apr 15, 2004
Sold by
Benedict Dena S
Bought by
Moore Harold P and Moore Josephine B
Purchase Details
Closed on
Mar 27, 2002
Sold by
Nor Wood Group Inc
Bought by
Benedict Dena S
Purchase Details
Closed on
Jan 9, 2001
Sold by
Ltd Partnership Debordieu Property Owner Buyo
Bought by
Moreland William Michael and Moreland Mary J
Purchase Details
Closed on
Jun 28, 2000
Sold by
Ltd Partnership Debordieu Property Owner Buyo
Bought by
Nor Wood Group Inc
Create a Home Valuation Report for This Property
The Home Valuation Report is an in-depth analysis detailing your home's value as well as a comparison with similar homes in the area
Home Values in the Area
Average Home Value in this Area
Purchase History
| Date | Buyer | Sale Price | Title Company |
|---|---|---|---|
| Royster James F | $450,000 | -- | |
| First Palmetto Savings Bank F S B | $400,000 | -- | |
| Moore Harold P | $550,000 | -- | |
| Benedict Dena S | $487,500 | -- | |
| Moreland William Michael | $155,000 | -- | |
| Nor Wood Group Inc | $69,500 | -- |
Source: Public Records
Tax History
| Year | Tax Paid | Tax Assessment Tax Assessment Total Assessment is a certain percentage of the fair market value that is determined by local assessors to be the total taxable value of land and additions on the property. | Land | Improvement |
|---|---|---|---|---|
| 2025 | $2,641 | $22,342 | $7,554 | $14,788 |
| 2024 | $2,641 | $19,430 | $5,000 | $14,430 |
| 2023 | $2,523 | $19,430 | $5,000 | $14,430 |
| 2022 | $2,319 | $19,430 | $5,000 | $14,430 |
| 2021 | $2,245 | $19,428 | $5,000 | $14,428 |
| 2020 | $2,239 | $19,428 | $5,000 | $14,428 |
| 2019 | $2,079 | $18,160 | $6,752 | $11,408 |
| 2018 | $2,124 | $181,600 | $0 | $0 |
| 2017 | $1,880 | $181,600 | $0 | $0 |
| 2016 | $1,856 | $18,160 | $0 | $0 |
| 2015 | $1,840 | $0 | $0 | $0 |
| 2014 | $6,298 | $454,000 | $168,800 | $285,200 |
| 2012 | -- | $514,000 | $168,800 | $345,200 |
Source: Public Records
Map
Nearby Homes
- 213 Old Carriage Loop
- 128 Lantana Cir
- 73 Lantana Cir
- 487 Lantana Cir
- 563 Lantana Cir
- 486 Lantana Cir Unit DeBordieu Colony
- 299 Colony Club Dr
- 302 Colony Club Dr Unit LOT 19 COLONY CLUB P
- 15 Pinckney Ln
- Lot 227 Summerwood Dr
- 113 Trotter Trail
- Lot 305 Wallace Pate Dr Unit Lot 305 and 1/2 Lot
- Lot 173 Sanderling Ave
- Lot 39 Jutland Ln Unit DeBordieu Colony
- 58 Swan Point Trail
- 575 Collins Meadow Dr
- 703 Collins Meadow Dr
- 224 Ocean Green Dr
- 96 Permit Ct
- 34 Dune Oaks Dr Unit DeBordieu Colony
- 196 Old Carriage Loop Unit FPS
- 164 Old Carriage Loop
- 222 Old Carriage Loop
- 222 Old Carriage Loop Unit Lot 13, Patewood Sou
- Lot 1 Old Carraige Loop
- Lot 1 Old Carraige Loop Unit Lot 1, Patewood Sout
- Lot 18 Old Carriage Loop
- Lot 23 Old Carraige Loop Unit Patewood South - DeB
- Lot 18 Old Carriage Loop Unit 92 Old Carriage Lp -
- Lot 24 Old Carriage Loop Unit Patewood South - DeB
- Lot 31 Old Carriage Loop Unit Lot 31, Patewood Sou
- 138 Old Carriage Loop Unit DeBordieu - JOH
- 138 Old Carriage Loop Unit JOH
- 138 Old Carriage Loop
- 158 Old Carriage Loop
- 158 Old Carriage Loop Unit Lot 25, Patewood Sou
- 183 Old Carriage Loop
- 183 Old Carriage Loop Unit Lot 26, Patewood Sou
- 242 Old Carriage Loop
- 159 Old Carriage Loop
Your Personal Tour Guide
Ask me questions while you tour the home.