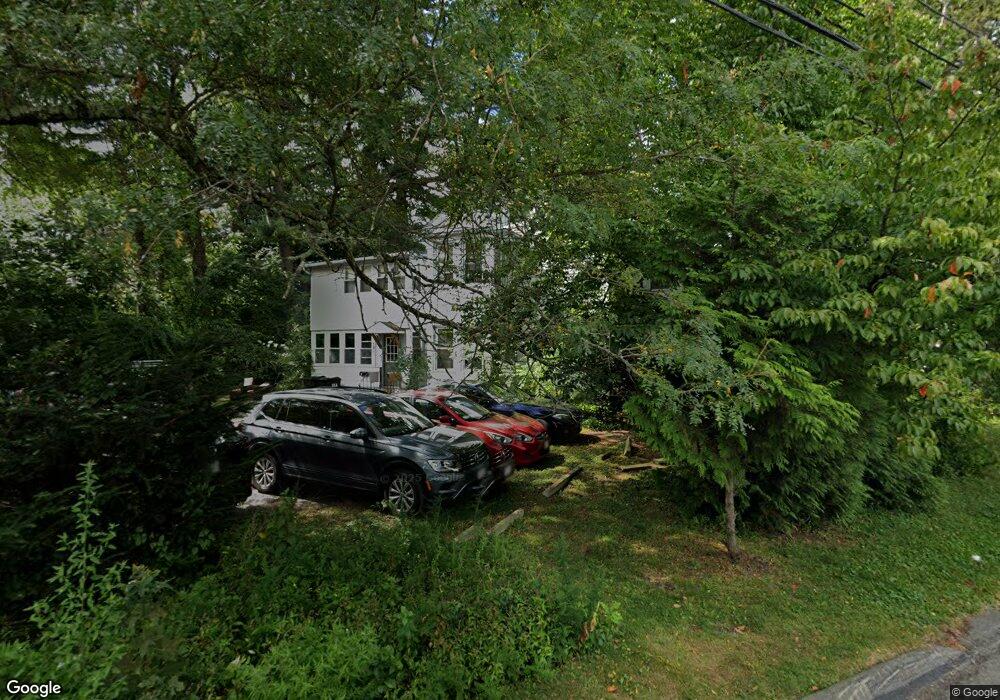
196 Triangle St Amherst, MA 01002
Estimated Value: $487,000 - $765,000
4
Beds
2
Baths
2,368
Sq Ft
$277/Sq Ft
Est. Value
About This Home
This home is located at 196 Triangle St, Amherst, MA 01002 and is currently estimated at $655,888, approximately $276 per square foot. 196 Triangle St is a home located in Hampshire County with nearby schools including Wildwood Elementary School, Amherst Regional Middle School, and Amherst Regional High School.
Ownership History
Date
Name
Owned For
Owner Type
Purchase Details
Closed on
Dec 11, 2009
Sold by
Fleming James
Bought by
Good Ol Daves Llc
Current Estimated Value
Purchase Details
Closed on
Jun 30, 2000
Sold by
Foley John L and Foley Pauline S
Bought by
Shahar Haim
Home Financials for this Owner
Home Financials are based on the most recent Mortgage that was taken out on this home.
Original Mortgage
$124,000
Interest Rate
8.59%
Mortgage Type
Purchase Money Mortgage
Purchase Details
Closed on
Aug 15, 1995
Sold by
Kosakowski Anne C and Kosakowski Helen E
Bought by
Foley John L and Foley Pauline S
Home Financials for this Owner
Home Financials are based on the most recent Mortgage that was taken out on this home.
Original Mortgage
$117,900
Interest Rate
7.48%
Mortgage Type
Purchase Money Mortgage
Create a Home Valuation Report for This Property
The Home Valuation Report is an in-depth analysis detailing your home's value as well as a comparison with similar homes in the area
Home Values in the Area
Average Home Value in this Area
Purchase History
| Date | Buyer | Sale Price | Title Company |
|---|---|---|---|
| Good Ol Daves Llc | -- | -- | |
| Shahar Haim | $155,000 | -- | |
| Foley John L | $131,000 | -- |
Source: Public Records
Mortgage History
| Date | Status | Borrower | Loan Amount |
|---|---|---|---|
| Previous Owner | Foley John L | $123,300 | |
| Previous Owner | Foley John L | $124,000 | |
| Previous Owner | Foley John L | $117,900 |
Source: Public Records
Tax History
| Year | Tax Paid | Tax Assessment Tax Assessment Total Assessment is a certain percentage of the fair market value that is determined by local assessors to be the total taxable value of land and additions on the property. | Land | Improvement |
|---|---|---|---|---|
| 2025 | $105 | $587,700 | $201,700 | $386,000 |
| 2024 | $9,962 | $538,200 | $190,300 | $347,900 |
| 2023 | $9,505 | $472,900 | $173,000 | $299,900 |
| 2022 | $9,152 | $430,300 | $157,200 | $273,100 |
| 2021 | $9,138 | $418,800 | $145,700 | $273,100 |
| 2020 | $8,929 | $418,800 | $145,700 | $273,100 |
| 2019 | $8,594 | $394,200 | $145,700 | $248,500 |
| 2018 | $8,333 | $394,200 | $145,700 | $248,500 |
| 2017 | $8,110 | $371,500 | $138,700 | $232,800 |
| 2016 | $7,883 | $371,500 | $138,700 | $232,800 |
| 2015 | $7,631 | $371,500 | $138,700 | $232,800 |
Source: Public Records
Map
Nearby Homes
- 0 Main St
- 48 Gray St
- 60 Red Gate Ln
- 0 Red Gate Ln Unit 73348273
- 75 Amity Place Unit 75
- 63 Amity Place Unit 63
- 270 N East St
- 24 Greenleaves Dr Unit 418
- 30 Greenleaves Dr
- 39 Valley Ln
- 26 Greenleaves Dr Unit 635
- 27 Greenleaves Dr Unit 726
- 185 Cherry Ln
- 310 Belchertown Rd
- Lot 3 Roosevelt St
- 0 Heatherstone Rd
- 12 Teawaddle Ln
- 0 Amherst Rd
- Lot A Kingman Rd
- 170 E Hadley Rd Unit 87
- 24 Smith St
- 176 Triangle St
- 169 Triangle St
- 22 Smith St
- 18 Windridge St
- 160 Triangle St
- 167 Triangle St
- 5 Pray St
- 1 Pray St
- 15 Smith St
- 161 Triangle St
- 6 Smith St
- 228 Triangle St
- 228 Triangle St Unit 1
- 228 Triangle St Unit 2
- 86 Kellogg Ave
- 80 Kellogg Ave
- 7 Smith St
- 152 Triangle St
- 00 Confidential Center
Your Personal Tour Guide
Ask me questions while you tour the home.