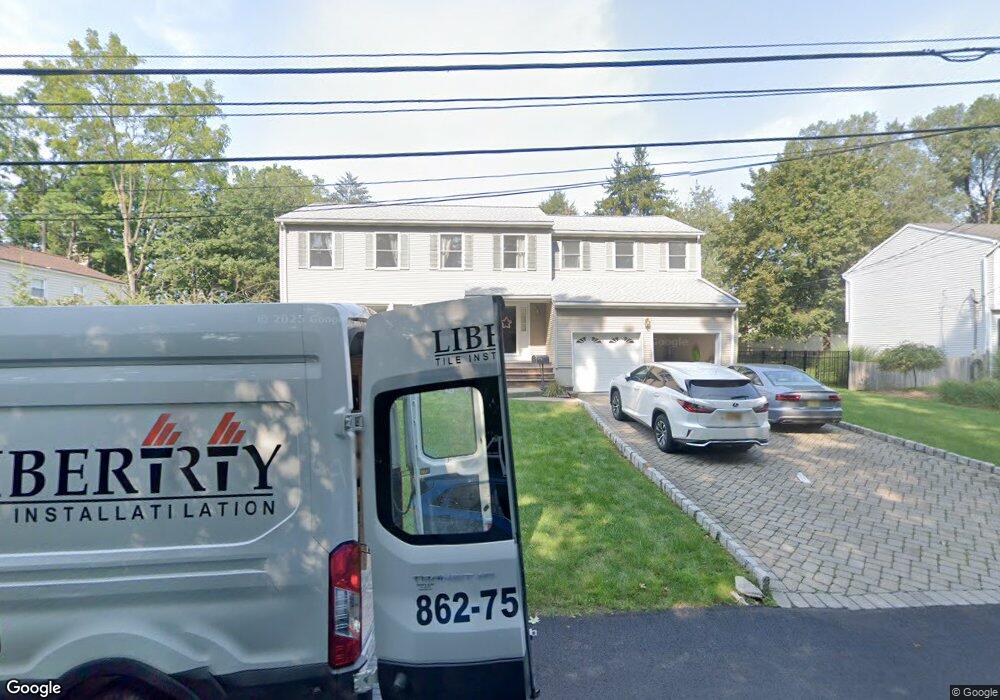
196 W Shore Rd Harrington Park, NJ 07640
Estimated Value: $893,697 - $949,000
--
Bed
--
Bath
2,723
Sq Ft
$339/Sq Ft
Est. Value
About This Home
This home is located at 196 W Shore Rd, Harrington Park, NJ 07640 and is currently estimated at $922,424, approximately $338 per square foot. 196 W Shore Rd is a home located in Bergen County with nearby schools including Harrington Park Elementary School, Northern Valley Regional High School at Old Tappan, and Acton Academy of Bergen County.
Ownership History
Date
Name
Owned For
Owner Type
Purchase Details
Closed on
Jul 1, 2014
Sold by
Kaberle Clare P
Bought by
Aguado Peter and Aguado Deena
Current Estimated Value
Home Financials for this Owner
Home Financials are based on the most recent Mortgage that was taken out on this home.
Original Mortgage
$450,000
Outstanding Balance
$342,509
Interest Rate
4.14%
Mortgage Type
New Conventional
Estimated Equity
$579,915
Create a Home Valuation Report for This Property
The Home Valuation Report is an in-depth analysis detailing your home's value as well as a comparison with similar homes in the area
Home Values in the Area
Average Home Value in this Area
Purchase History
| Date | Buyer | Sale Price | Title Company |
|---|---|---|---|
| Aguado Peter | $500,000 | -- |
Source: Public Records
Mortgage History
| Date | Status | Borrower | Loan Amount |
|---|---|---|---|
| Open | Aguado Peter | $450,000 |
Source: Public Records
Tax History Compared to Growth
Tax History
| Year | Tax Paid | Tax Assessment Tax Assessment Total Assessment is a certain percentage of the fair market value that is determined by local assessors to be the total taxable value of land and additions on the property. | Land | Improvement |
|---|---|---|---|---|
| 2025 | $17,045 | $545,100 | $238,500 | $306,600 |
| 2024 | $15,910 | $545,100 | $238,500 | $306,600 |
| 2023 | $15,647 | $524,900 | $238,500 | $286,400 |
| 2022 | $15,647 | $524,900 | $238,500 | $286,400 |
| 2021 | $15,537 | $524,900 | $238,500 | $286,400 |
| 2020 | $15,469 | $524,900 | $238,500 | $286,400 |
| 2019 | $15,143 | $524,900 | $238,500 | $286,400 |
| 2018 | $14,865 | $524,900 | $238,500 | $286,400 |
| 2017 | $14,708 | $524,900 | $238,500 | $286,400 |
| 2016 | $14,288 | $524,900 | $238,500 | $286,400 |
| 2015 | $13,931 | $524,900 | $238,500 | $286,400 |
| 2014 | $13,611 | $524,900 | $238,500 | $286,400 |
Source: Public Records
Map
Nearby Homes