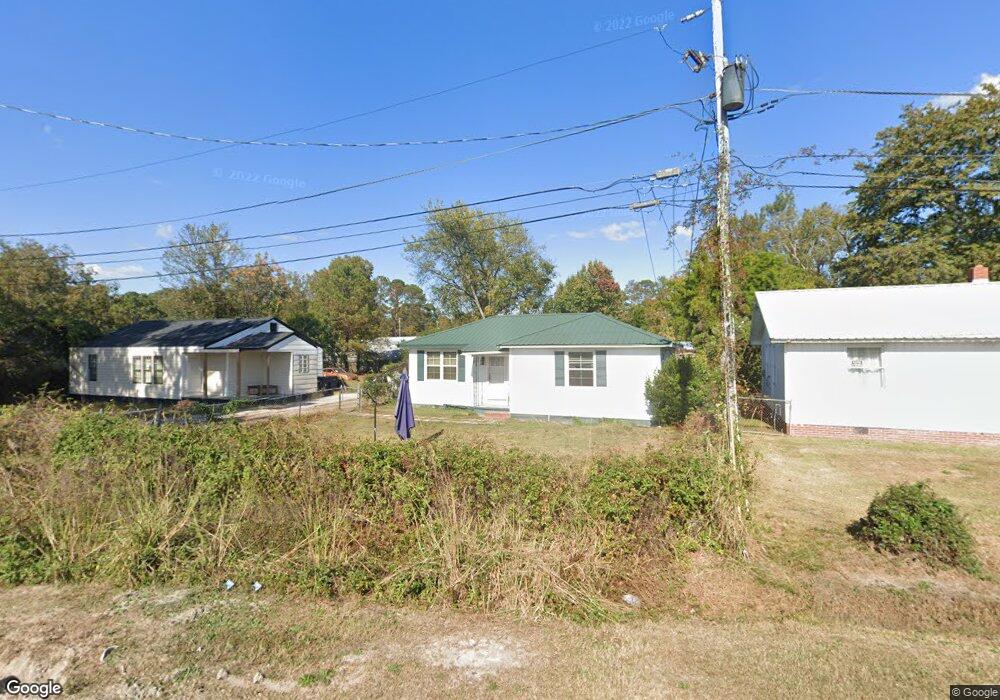
1960 Minor Place Augusta, GA 30906
Richmond Hill NeighborhoodEstimated Value: $98,000 - $120,000
3
Beds
1
Bath
1,300
Sq Ft
$83/Sq Ft
Est. Value
About This Home
This home is located at 1960 Minor Place, Augusta, GA 30906 and is currently estimated at $108,350, approximately $83 per square foot. 1960 Minor Place is a home located in Richmond County with nearby schools including Wilkinson Gardens Elementary School, Murphey Middle School, and Johnson Magnet.
Ownership History
Date
Name
Owned For
Owner Type
Purchase Details
Closed on
Sep 25, 2024
Sold by
Smith Charles E
Bought by
Smith Kadine Dashand
Current Estimated Value
Purchase Details
Closed on
Nov 12, 2021
Sold by
Parris Walter Lee
Bought by
Smith Charles E and Smith Jackie W
Purchase Details
Closed on
Feb 7, 2012
Sold by
Rtg Investments Llc
Bought by
Parris Walter L
Home Financials for this Owner
Home Financials are based on the most recent Mortgage that was taken out on this home.
Original Mortgage
$15,800
Interest Rate
3.91%
Mortgage Type
New Conventional
Purchase Details
Closed on
Oct 5, 2004
Sold by
Patterson Frank Eugene and Patterson Anna Elizabeth
Bought by
Chaplin Investments Llc
Home Financials for this Owner
Home Financials are based on the most recent Mortgage that was taken out on this home.
Original Mortgage
$37,000
Interest Rate
5.71%
Mortgage Type
Purchase Money Mortgage
Create a Home Valuation Report for This Property
The Home Valuation Report is an in-depth analysis detailing your home's value as well as a comparison with similar homes in the area
Home Values in the Area
Average Home Value in this Area
Purchase History
| Date | Buyer | Sale Price | Title Company |
|---|---|---|---|
| Smith Kadine Dashand | -- | -- | |
| Smith Charles E | -- | -- | |
| Parris Walter L | $19,800 | -- | |
| Chaplin Investments Llc | $22,000 | -- |
Source: Public Records
Mortgage History
| Date | Status | Borrower | Loan Amount |
|---|---|---|---|
| Previous Owner | Parris Walter L | $15,800 | |
| Previous Owner | Chaplin Investments Llc | $37,000 |
Source: Public Records
Tax History Compared to Growth
Tax History
| Year | Tax Paid | Tax Assessment Tax Assessment Total Assessment is a certain percentage of the fair market value that is determined by local assessors to be the total taxable value of land and additions on the property. | Land | Improvement |
|---|---|---|---|---|
| 2025 | $1,058 | $26,892 | $2,800 | $24,092 |
| 2024 | $1,058 | $26,092 | $2,800 | $23,292 |
| 2023 | $969 | $27,032 | $2,800 | $24,232 |
| 2022 | $728 | $11,881 | $2,800 | $9,081 |
| 2021 | $739 | $11,175 | $2,800 | $8,375 |
| 2020 | $744 | $11,555 | $2,800 | $8,755 |
| 2019 | $811 | $13,616 | $4,400 | $9,216 |
| 2018 | $684 | $13,616 | $4,400 | $9,216 |
| 2017 | $623 | $13,616 | $4,400 | $9,216 |
| 2016 | $623 | $13,616 | $4,400 | $9,216 |
| 2015 | $627 | $13,616 | $4,400 | $9,216 |
| 2014 | $675 | $13,056 | $4,400 | $8,656 |
Source: Public Records
Map
Nearby Homes
- 1964 Barnes Rd
- 1915 Olive Rd
- 2013 Shark Dr
- 2011 Shark Dr
- 2002 Shark Dr
- 1921 3rd Ave
- 2216 Sullivan Rd
- 2137 Gatewood Dr
- 2137 Gatewood Dr
- 1915 1st Ave
- 2469 Reese Ave
- 2440 Peach Orchard Rd
- 2472 Reese Ave
- 855 15th Ave
- 857 15th Ave
- 1755 Nixon Rd
- 2437 Mike Padgett Hwy
- 2487 Reese Ave
- 959 14th Ave
- 1895 Virginia Ave
- 1958 Minor Place
- 1962 Minor Place
- 1958 Minor Place
- 1959 Lionel St
- 1956 Minor Place
- 1957 Lionel St
- 1961 Lionel St
- 1966 Minor Place
- 1955 Lionel St
- 1963 Lionel St
- 1935 Lionel St
- 1965 Lionel St
- 1967 Lionel St
- 314 Memory Dr
- 1535 Gordon Hwy
- 1972 Minor Place
- 1969 Lionel St
- 1960 Lionel St
- 1958 Lionel St
- 1962 Lionel St