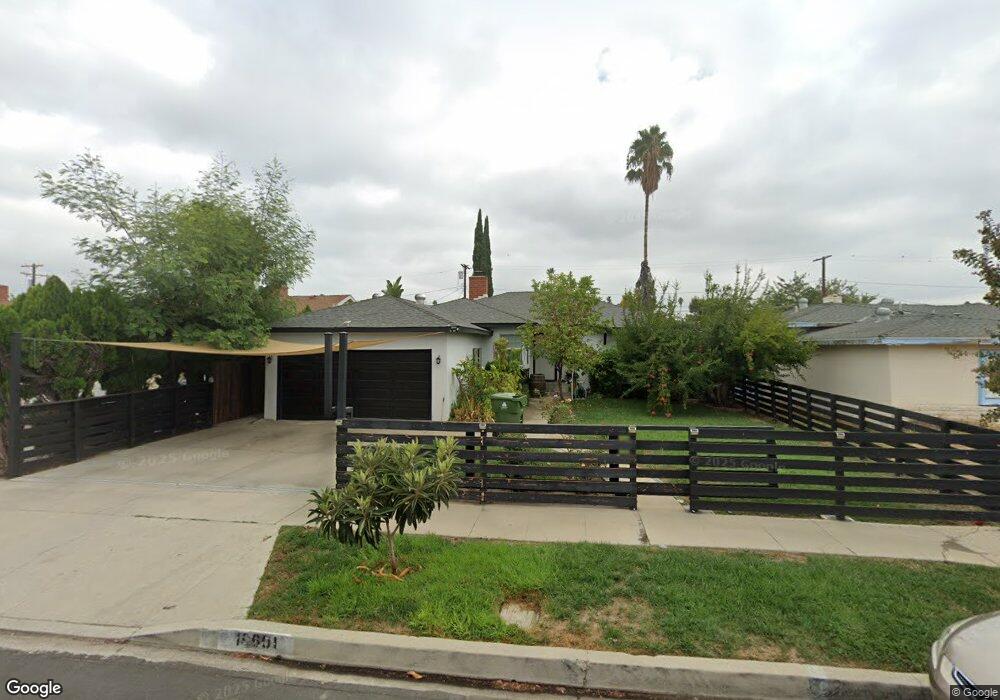
19601 Vose St Reseda, CA 91335
Estimated Value: $815,000 - $939,435
4
Beds
3
Baths
1,853
Sq Ft
$478/Sq Ft
Est. Value
About This Home
This home is located at 19601 Vose St, Reseda, CA 91335 and is currently estimated at $886,359, approximately $478 per square foot. 19601 Vose St is a home located in Los Angeles County with nearby schools including Shirley Avenue Elementary School, John A. Sutter Middle School, and Calvert Charter for Enriched Studies.
Ownership History
Date
Name
Owned For
Owner Type
Purchase Details
Closed on
Feb 3, 2021
Sold by
Pootaraksa Choompol and Pootaraksa Kamolmal
Bought by
Pootaraksa Choompol and Pootaraksa Kamolmal
Current Estimated Value
Home Financials for this Owner
Home Financials are based on the most recent Mortgage that was taken out on this home.
Original Mortgage
$360,000
Outstanding Balance
$318,433
Interest Rate
2.6%
Mortgage Type
New Conventional
Estimated Equity
$567,926
Purchase Details
Closed on
Aug 8, 1994
Sold by
Furuta Toshiki and Furuta Tomoko
Bought by
Pootaraksa Choompol
Home Financials for this Owner
Home Financials are based on the most recent Mortgage that was taken out on this home.
Original Mortgage
$150,000
Interest Rate
8.8%
Mortgage Type
Seller Take Back
Create a Home Valuation Report for This Property
The Home Valuation Report is an in-depth analysis detailing your home's value as well as a comparison with similar homes in the area
Home Values in the Area
Average Home Value in this Area
Purchase History
| Date | Buyer | Sale Price | Title Company |
|---|---|---|---|
| Pootaraksa Choompol | -- | First American Title Company O | |
| Pootaraksa Choompol | -- | Title Land Company |
Source: Public Records
Mortgage History
| Date | Status | Borrower | Loan Amount |
|---|---|---|---|
| Open | Pootaraksa Choompol | $360,000 | |
| Previous Owner | Pootaraksa Choompol | $150,000 |
Source: Public Records
Tax History
| Year | Tax Paid | Tax Assessment Tax Assessment Total Assessment is a certain percentage of the fair market value that is determined by local assessors to be the total taxable value of land and additions on the property. | Land | Improvement |
|---|---|---|---|---|
| 2025 | $4,096 | $321,405 | $142,083 | $179,322 |
| 2024 | $4,052 | $315,104 | $139,298 | $175,806 |
| 2023 | $7,018 | $562,446 | $307,568 | $254,878 |
| 2022 | $6,695 | $551,419 | $301,538 | $249,881 |
| 2021 | $3,995 | $311,257 | $131,265 | $179,992 |
| 2020 | $4,031 | $308,067 | $129,920 | $178,147 |
| 2019 | $3,880 | $302,027 | $127,373 | $174,654 |
| 2018 | $3,746 | $296,106 | $124,876 | $171,230 |
| 2016 | $3,565 | $284,610 | $120,028 | $164,582 |
| 2015 | $3,515 | $280,336 | $118,226 | $162,110 |
| 2014 | $3,534 | $274,846 | $115,911 | $158,935 |
Source: Public Records
Map
Nearby Homes
- 7037 Tunney Ave
- 19427 Hart St
- 19545 Sherman Way Unit 47
- 19545 Sherman Way
- 19545 Sherman Way Unit 74
- 6838 Belmar Ave
- 6922 Tunney Ave
- 19431 Sherman Way Unit 6
- 7304 Corbin Ave Unit F
- 7308 Corbin Ave Unit G
- 19350 Sherman Way Unit 124
- 19350 Sherman Way Unit 210
- 6800 Corbin Ave Unit 308
- 19833 Bassett St
- 19355 Sherman Way Unit 42
- 6850 Tampa Ave
- 6644 Bothwell Rd
- 19950 Sherman Way Unit A
- 7414 Quartz Ave
- 19230 Wyandotte St Unit 14
Your Personal Tour Guide
Ask me questions while you tour the home.