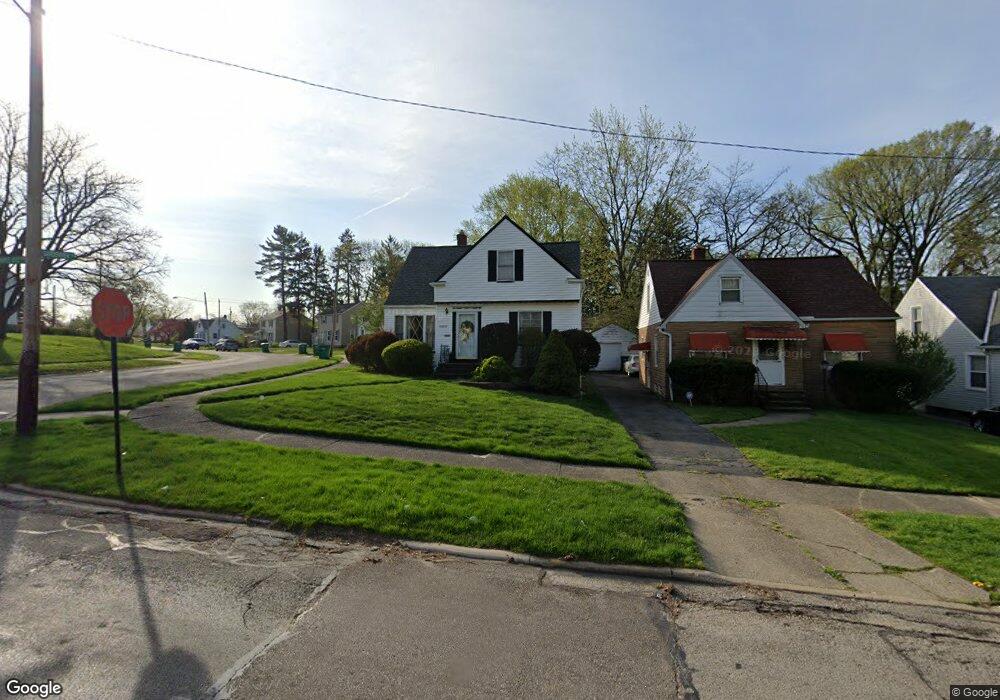
19610 Maple Heights Blvd Maple Heights, OH 44137
Estimated Value: $109,000 - $166,000
4
Beds
1
Bath
1,543
Sq Ft
$84/Sq Ft
Est. Value
About This Home
This home is located at 19610 Maple Heights Blvd, Maple Heights, OH 44137 and is currently estimated at $130,214, approximately $84 per square foot. 19610 Maple Heights Blvd is a home located in Cuyahoga County with nearby schools including Abraham Lincoln Elementary School, Rockside/ J.F. Kennedy School, and Italy High School.
Ownership History
Date
Name
Owned For
Owner Type
Purchase Details
Closed on
Nov 24, 1999
Sold by
Ciesla Michael
Bought by
Ciesla Margaret
Current Estimated Value
Purchase Details
Closed on
Oct 12, 1989
Sold by
Ciesla Michael
Bought by
Ciesla Margaret
Purchase Details
Closed on
Nov 26, 1980
Sold by
Mcconnell Sheila D
Bought by
Ciesla Michael
Purchase Details
Closed on
May 30, 1979
Sold by
Schmidt Robert G
Bought by
Mcconnell Sheila D
Purchase Details
Closed on
Jan 10, 1977
Sold by
Gergely Alex Z and Gergely Mary
Bought by
Schmidt Robert G
Purchase Details
Closed on
Jan 1, 1975
Bought by
Gergely Alex Z and Gergely Mary
Create a Home Valuation Report for This Property
The Home Valuation Report is an in-depth analysis detailing your home's value as well as a comparison with similar homes in the area
Home Values in the Area
Average Home Value in this Area
Purchase History
| Date | Buyer | Sale Price | Title Company |
|---|---|---|---|
| Ciesla Margaret | -- | -- | |
| Ciesla Margaret | -- | -- | |
| Ciesla Michael | $50,000 | -- | |
| Mcconnell Sheila D | $45,500 | -- | |
| Schmidt Robert G | $35,500 | -- | |
| Gergely Alex Z | -- | -- |
Source: Public Records
Tax History Compared to Growth
Tax History
| Year | Tax Paid | Tax Assessment Tax Assessment Total Assessment is a certain percentage of the fair market value that is determined by local assessors to be the total taxable value of land and additions on the property. | Land | Improvement |
|---|---|---|---|---|
| 2024 | $2,648 | $39,865 | $7,105 | $32,760 |
| 2023 | $1,542 | $23,560 | $4,060 | $19,500 |
| 2022 | $1,575 | $23,560 | $4,060 | $19,500 |
| 2021 | $1,678 | $23,560 | $4,060 | $19,500 |
| 2020 | $1,209 | $17,850 | $3,080 | $14,770 |
| 2019 | $1,312 | $51,000 | $8,800 | $42,200 |
| 2018 | $1,114 | $17,850 | $3,080 | $14,770 |
| 2017 | $2,150 | $16,730 | $2,870 | $13,860 |
| 2016 | $2,081 | $16,730 | $2,870 | $13,860 |
| 2015 | $2,085 | $16,730 | $2,870 | $13,860 |
| 2014 | $2,085 | $18,380 | $3,150 | $15,230 |
Source: Public Records
Map
Nearby Homes
- 19520 Maple Heights Blvd
- 19807 Gardenview Dr
- 19806 Mountville Dr
- 5165 Camden Rd
- 19309 Nitra Ave
- 19289 Stafford Ave
- 19812 Stockton Ave
- 20107 Libby Rd
- 5265 Bellview St
- 19221 Stafford Ave
- 20510 Mountville Dr
- 18909 Maple Heights Blvd
- 20120 Mccracken Rd
- 20701 Kenyon Dr
- 5409 Hollywood Ave
- 5357 Beechwood Ave
- 20814 Kenyon Dr
- 5234 Erwin St
- 20715 Watson Rd
- 20814 Watson Rd
- 19606 Maple Heights Blvd
- 19602 Maple Heights Blvd
- 19600 Gardenview Dr
- 19624 Maple Heights Blvd
- 19524 Maple Heights Blvd
- 19606 Gardenview Dr
- 19611 Gardenview Dr
- 19607 Maple Heights Blvd
- 19610 Gardenview Dr
- 19603 Maple Heights Blvd
- 19628 Maple Heights Blvd
- 19619 Maple Heights Blvd
- 19516 Maple Heights Blvd
- 19617 Gardenview Dr
- 19525 Maple Heights Blvd
- 19685 Mountville Dr
- 19701 Gardenview Dr
- 19510 Gardenview Dr
- 19693 Mountville Dr
- 19614 Gardenview Dr