19615 Platteview Rd Gretna, NE 68028
Estimated Value: $394,000
3
Beds
1
Bath
1,078
Sq Ft
$365/Sq Ft
Est. Value
About This Home
This home is located at 19615 Platteview Rd, Gretna, NE 68028 and is currently estimated at $394,000, approximately $365 per square foot. 19615 Platteview Rd is a home located in Sarpy County with nearby schools including Platteview Central Junior High School and Platteview Senior High School.
Ownership History
Date
Name
Owned For
Owner Type
Purchase Details
Closed on
Nov 2, 2020
Sold by
Big Red Ruby Llc
Bought by
Melvin H Timm Family Limited Partnership
Current Estimated Value
Purchase Details
Closed on
Mar 18, 2020
Sold by
Sisco Carol Ann and Sisco Paul J
Bought by
Big Red Ruby Llc
Purchase Details
Closed on
Jan 2, 2020
Sold by
Sisco Paul J and Sisco Carol Ann
Bought by
Lynam Ryan and Lynam Alyssa
Home Financials for this Owner
Home Financials are based on the most recent Mortgage that was taken out on this home.
Original Mortgage
$279,704
Interest Rate
3.6%
Mortgage Type
Future Advance Clause Open End Mortgage
Purchase Details
Closed on
Dec 16, 2016
Sold by
Thiemann Elaine Frances
Bought by
Sisco Carol Ann
Purchase Details
Closed on
Jan 12, 2011
Sold by
Sisco Carol Ann and Sisco Paul J
Bought by
Fischer Enterprises Llc
Create a Home Valuation Report for This Property
The Home Valuation Report is an in-depth analysis detailing your home's value as well as a comparison with similar homes in the area
Home Values in the Area
Average Home Value in this Area
Purchase History
| Date | Buyer | Sale Price | Title Company |
|---|---|---|---|
| Melvin H Timm Family Limited Partnership | $9,161,000 | Titlecore National Llc | |
| Big Red Ruby Llc | $1,352,000 | Titlecore National Llc | |
| Lynam Ryan | $349,000 | Midwest Title Inc | |
| Sisco Carol Ann | -- | None Available | |
| Fischer Enterprises Llc | -- | None Available |
Source: Public Records
Mortgage History
| Date | Status | Borrower | Loan Amount |
|---|---|---|---|
| Previous Owner | Lynam Ryan | $279,704 |
Source: Public Records
Tax History Compared to Growth
Tax History
| Year | Tax Paid | Tax Assessment Tax Assessment Total Assessment is a certain percentage of the fair market value that is determined by local assessors to be the total taxable value of land and additions on the property. | Land | Improvement |
|---|---|---|---|---|
| 2025 | $4,033 | $609,635 | $602,264 | -- |
| 2024 | $5,275 | $509,068 | $501,445 | -- |
| 2023 | $5,275 | $461,989 | $454,690 | -- |
| 2022 | $5,224 | $455,848 | $448,321 | $7,527 |
| 2021 | $6,013 | $468,908 | $447,575 | $21,333 |
| 2020 | $6,640 | $456,652 | $456,652 | $0 |
| 2019 | $8,417 | $581,164 | $581,164 | $0 |
| 2018 | $8,957 | $627,063 | $607,284 | $19,779 |
| 2017 | $9,086 | $625,825 | $606,460 | $19,365 |
| 2016 | $10,473 | $705,884 | $690,512 | $15,372 |
| 2015 | $10,120 | $927,141 | $834,227 | $92,914 |
| 2014 | $11,168 | $745,615 | $651,211 | $94,404 |
| 2012 | -- | $667,404 | $575,744 | $72,461 |
Source: Public Records
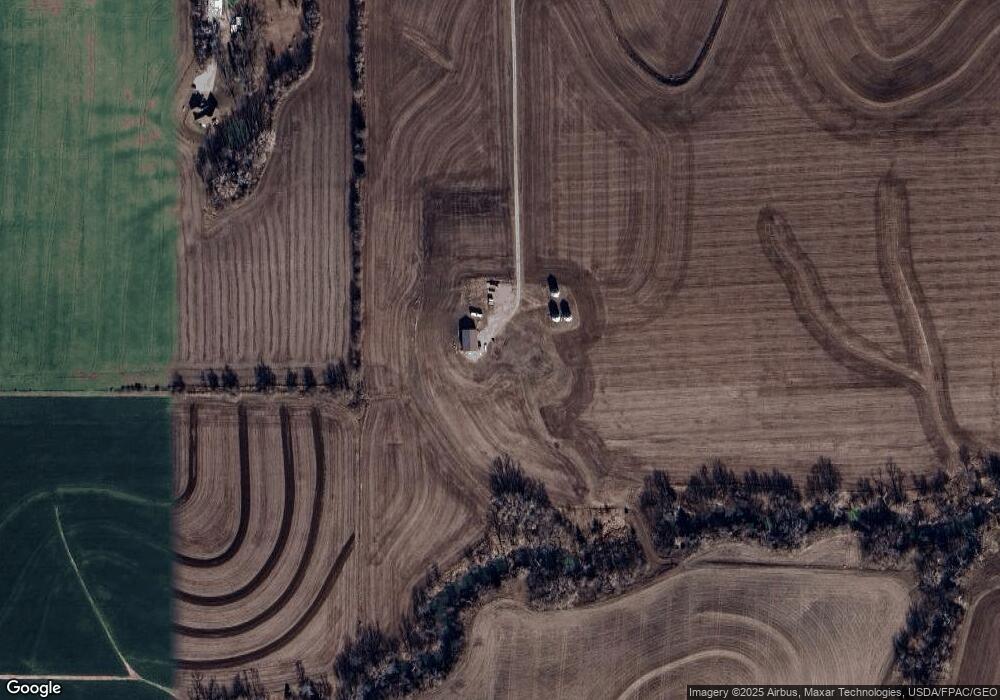
Map
Nearby Homes
- 19802 Fairview Rd
- 19810 Fairview Rd
- 21804 Hackberry Dr
- Albany Plan at Gruenther Ridge
- Lansing Plan at Gruenther Ridge
- Madison Plan at Gruenther Ridge
- Lincoln Plan at Gruenther Ridge
- Harrisburg Plan at Gruenther Ridge
- Montgomery 1734 Plan at Gruenther Ridge
- Montgomery 1892 Plan at Gruenther Ridge
- Jackson Plan at Gruenther Ridge
- Montgomery 1922 Plan at Gruenther Ridge
- Pierre 1934 Plan at Gruenther Ridge
- Pierre 1889 Plan at Gruenther Ridge
- Albany Plan at Deer Hollow
- Lincoln Plan at Deer Hollow
- Madison Plan at Deer Hollow
- Harrisburg Plan at Deer Hollow
- Jackson Plan at Deer Hollow
- Montgomery 1734 Plan at Deer Hollow
- 19901 Platteview Rd
- 19806 Platteview Rd
- 19910 Platteview Rd
- 15005 S 200th Cir
- 15104 S 200th Cir
- 15010 S 200th Cir
- 15002 S 200th Cir
- 20112 Platteview Rd
- 20204 Platteview Rd
- 20250 Platteview Rd
- 15709 S 204th St
- 18902 Platteview Rd
- 14901 S 204th St
- 192 Platteview Rd
- 20509 Platteview Rd
- 20605 Platteview Rd
- 14700 S 204th St
- 18701 Platteview Rd
- 14704 S 204th St
- 16406 S 192nd St