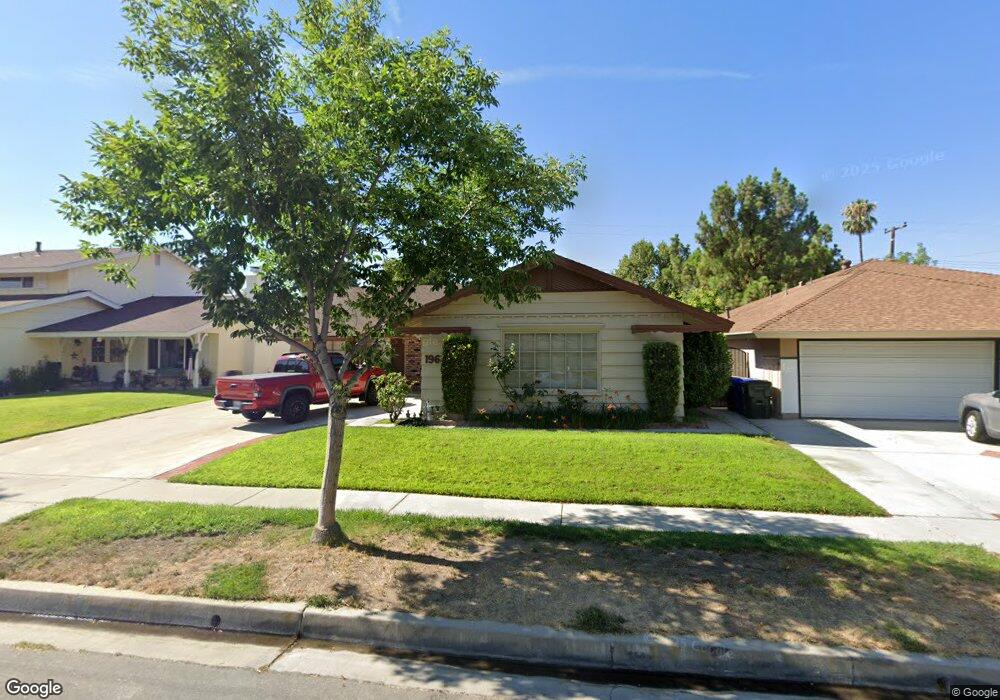
19620 4 Oaks St Canyon Country, CA 91351
Estimated Value: $744,000 - $841,000
3
Beds
2
Baths
1,598
Sq Ft
$488/Sq Ft
Est. Value
About This Home
This home is located at 19620 4 Oaks St, Canyon Country, CA 91351 and is currently estimated at $779,136, approximately $487 per square foot. 19620 4 Oaks St is a home located in Los Angeles County with nearby schools including Cedarcreek Elementary School, Sierra Vista Junior High School, and Canyon High School.
Ownership History
Date
Name
Owned For
Owner Type
Purchase Details
Closed on
Sep 14, 2018
Sold by
Clark Kevin J and Johnnie Lenard Clark Family Tr
Bought by
Otey Alma
Current Estimated Value
Home Financials for this Owner
Home Financials are based on the most recent Mortgage that was taken out on this home.
Original Mortgage
$425,000
Outstanding Balance
$369,862
Interest Rate
4.5%
Mortgage Type
New Conventional
Estimated Equity
$409,274
Purchase Details
Closed on
Jul 3, 1996
Sold by
Clark Johnnie L
Bought by
Clark Johnnie Lenard and Johnnie Lenard Clark Family Tr
Purchase Details
Closed on
Jul 8, 1994
Sold by
Blackburn Delbert and Blackburn Mary Alice
Bought by
Clark Johnnie L
Home Financials for this Owner
Home Financials are based on the most recent Mortgage that was taken out on this home.
Original Mortgage
$115,000
Interest Rate
8.73%
Create a Home Valuation Report for This Property
The Home Valuation Report is an in-depth analysis detailing your home's value as well as a comparison with similar homes in the area
Home Values in the Area
Average Home Value in this Area
Purchase History
| Date | Buyer | Sale Price | Title Company |
|---|---|---|---|
| Otey Alma | $500,000 | Priority Title | |
| Clark Johnnie Lenard | -- | -- | |
| Clark Johnnie L | $165,000 | World Title |
Source: Public Records
Mortgage History
| Date | Status | Borrower | Loan Amount |
|---|---|---|---|
| Open | Otey Alma | $425,000 | |
| Previous Owner | Clark Johnnie L | $115,000 |
Source: Public Records
Tax History Compared to Growth
Tax History
| Year | Tax Paid | Tax Assessment Tax Assessment Total Assessment is a certain percentage of the fair market value that is determined by local assessors to be the total taxable value of land and additions on the property. | Land | Improvement |
|---|---|---|---|---|
| 2025 | $7,386 | $557,754 | $351,274 | $206,480 |
| 2024 | $7,386 | $546,819 | $344,387 | $202,432 |
| 2023 | $7,195 | $536,098 | $337,635 | $198,463 |
| 2022 | $7,235 | $525,587 | $331,015 | $194,572 |
| 2021 | $7,119 | $515,282 | $324,525 | $190,757 |
| 2019 | $6,879 | $500,000 | $314,900 | $185,100 |
| 2018 | $2,240 | $133,095 | $37,343 | $95,752 |
| 2016 | $2,086 | $127,929 | $35,894 | $92,035 |
| 2015 | $2,007 | $126,008 | $35,355 | $90,653 |
| 2014 | $1,973 | $123,541 | $34,663 | $88,878 |
Source: Public Records
Map
Nearby Homes
- 19615 Cedarcreek St
- 19631 Fairweather St
- 27520 Glasser Ave
- 19460 Delight St
- 19842 Canyon View Dr
- 27809 Blue Sky Ln
- 27845 Camp Plenty Rd
- 27829 Sunrise Ln
- 27828 Spyglass Ln
- 27859 Camp Plenty Rd
- 20033 Emerald Creek Dr
- 27852 Rosamond Dr
- 27419 Fairport Ave
- 19983 Crest View Dr
- 20042 Canyon View Dr Unit 74
- 27508 Esterbrook Ave
- 20073 Edgewater Dr
- 20066 Crest View Dr
- 20095 Shadow Island Dr
- 20401 Soledad Canyon Rd Unit 231
- 19620 Four Oaks St
- 19626 Four Oaks St
- 19626 4 Oaks St
- 19614 4 Oaks St
- 19621 Cedarcreek St
- 19630 4 Oaks St
- 19608 4 Oaks St
- 19627 Cedarcreek St
- 19631 Cedarcreek St
- 19621 4 Oaks St
- 19621 Four Oaks St
- 19609 Cedarcreek St
- 19625 4 Oaks St
- 19600 4 Oaks St
- 19636 Four Oaks St
- 19636 4 Oaks St
- 19615 4 Oaks St
- 19631 Four Oaks St
- 19631 4 Oaks St
- 19637 Cedarcreek St