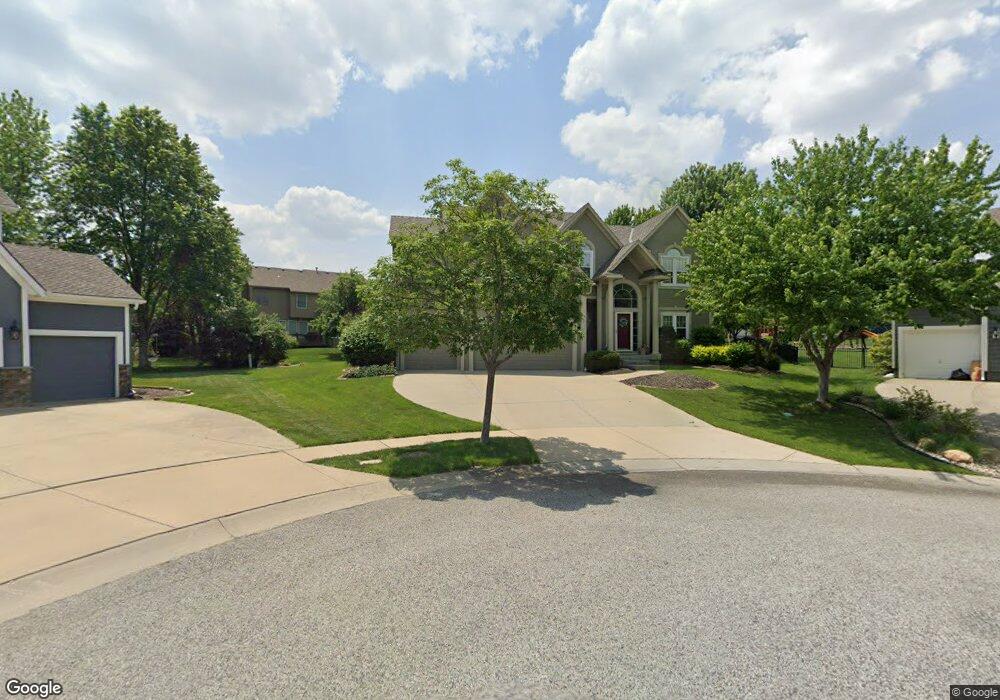
19627 W 98th Terrace Lenexa, KS 66220
Estimated Value: $566,000 - $653,000
4
Beds
4
Baths
3,050
Sq Ft
$195/Sq Ft
Est. Value
About This Home
This home is located at 19627 W 98th Terrace, Lenexa, KS 66220 and is currently estimated at $593,911, approximately $194 per square foot. 19627 W 98th Terrace is a home located in Johnson County with nearby schools including Manchester Park Elementary School, Prairie Trail Middle School, and Olathe Northwest High School.
Ownership History
Date
Name
Owned For
Owner Type
Purchase Details
Closed on
May 10, 2004
Sold by
Caspari Danielle R and Nelson Danielle C
Bought by
Hampton Stanley C and Hampton Kimberly D
Current Estimated Value
Home Financials for this Owner
Home Financials are based on the most recent Mortgage that was taken out on this home.
Original Mortgage
$248,000
Outstanding Balance
$114,767
Interest Rate
5.53%
Mortgage Type
Purchase Money Mortgage
Estimated Equity
$479,144
Purchase Details
Closed on
Sep 17, 2001
Sold by
Glen A Mock Construction & Design Inc
Bought by
Nelson Randall A and Nelson Danielle C
Home Financials for this Owner
Home Financials are based on the most recent Mortgage that was taken out on this home.
Original Mortgage
$236,400
Interest Rate
6.77%
Purchase Details
Closed on
Feb 23, 2001
Sold by
Falcon Valley Llc
Bought by
Glen A Mock Construction & Design Inc
Home Financials for this Owner
Home Financials are based on the most recent Mortgage that was taken out on this home.
Original Mortgage
$220,000
Interest Rate
7.1%
Mortgage Type
Construction
Create a Home Valuation Report for This Property
The Home Valuation Report is an in-depth analysis detailing your home's value as well as a comparison with similar homes in the area
Home Values in the Area
Average Home Value in this Area
Purchase History
| Date | Buyer | Sale Price | Title Company |
|---|---|---|---|
| Hampton Stanley C | -- | Security Land Title Company | |
| Nelson Randall A | -- | Security Land Title Company | |
| Glen A Mock Construction & Design Inc | -- | Security Land Title Company |
Source: Public Records
Mortgage History
| Date | Status | Borrower | Loan Amount |
|---|---|---|---|
| Open | Hampton Stanley C | $248,000 | |
| Previous Owner | Nelson Randall A | $236,400 | |
| Previous Owner | Glen A Mock Construction & Design Inc | $220,000 | |
| Closed | Glen A Mock Construction & Design Inc | $50,000 | |
| Closed | Hampton Stanley C | $30,000 |
Source: Public Records
Tax History Compared to Growth
Tax History
| Year | Tax Paid | Tax Assessment Tax Assessment Total Assessment is a certain percentage of the fair market value that is determined by local assessors to be the total taxable value of land and additions on the property. | Land | Improvement |
|---|---|---|---|---|
| 2024 | $7,176 | $58,397 | $11,645 | $46,752 |
| 2023 | $6,863 | $54,821 | $11,645 | $43,176 |
| 2022 | $6,655 | $51,842 | $8,960 | $42,882 |
| 2021 | $6,045 | $44,770 | $8,960 | $35,810 |
| 2020 | $5,417 | $39,687 | $8,960 | $30,727 |
| 2019 | $5,601 | $40,756 | $7,797 | $32,959 |
| 2018 | $5,271 | $37,904 | $7,797 | $30,107 |
| 2017 | $5,367 | $37,778 | $7,797 | $29,981 |
| 2016 | $5,140 | $36,995 | $7,423 | $29,572 |
| 2015 | $4,910 | $35,339 | $7,423 | $27,916 |
| 2013 | -- | $34,063 | $7,423 | $26,640 |
Source: Public Records
Map
Nearby Homes
- 9835 Walker St
- 9844 Stevenson St
- 19220 W 98th Terrace
- 9917 Fountain Cir
- 18932 W 100th St
- 9500 Woodland Rd
- 0 W 95th St
- 18804 W 99th St
- 9517 Falcon Ridge Dr
- 18732 W 99th St
- 20516 W 98th Place
- 18637 W 97th Terrace
- 9705 Sunset Cir
- 20802 W 102nd St
- 22003 W 100th Terrace
- 20914 W 96th Terrace
- 20825 W 94th Terrace
- 20308 W 92nd St
- 21111 W 95th Terrace
- 21123 W 95th Terrace
- 19629 W 98th Terrace
- 19618 W 99th St
- 19622 W 99th St
- 19625 W 98th Terrace
- 19614 W 99th St
- 19626 W 99th St
- 19631 W 98th Terrace
- 9843 Stevenson St
- 9837 Stevenson St
- 19623 W 98th Terrace
- 19610 W 99th St
- 9831 Stevenson St
- 19630 W 99th St
- 19621 W 98th Terrace
- 19621 W 99th St
- 19606 W 99th St
- 19625 W 99th St
- 19617 W 99th St
- 19629 W 99th St
- 9836 Walker St