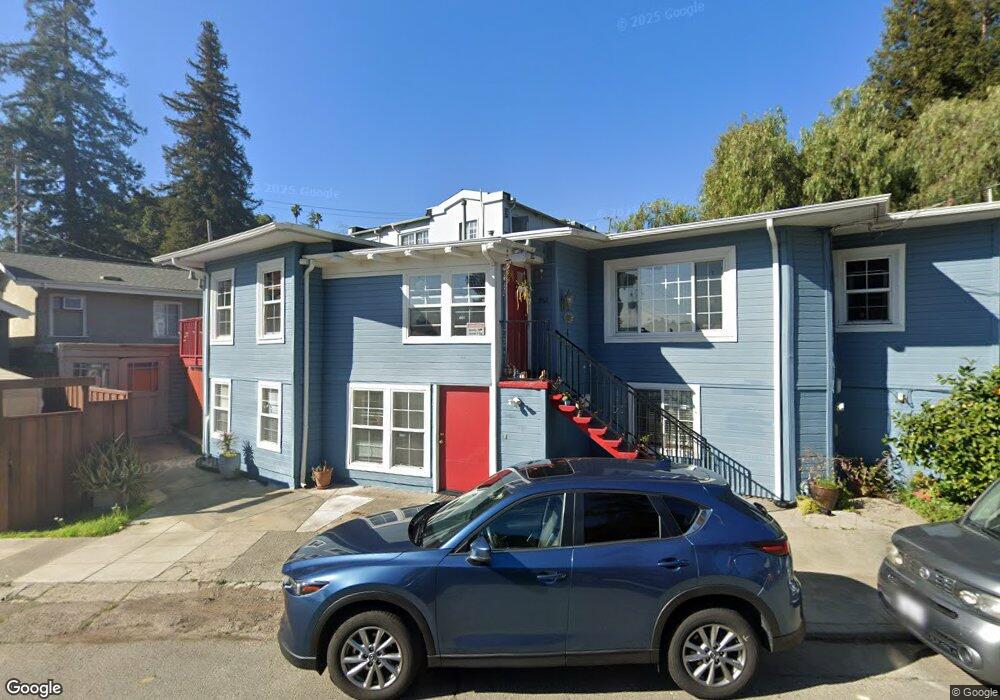
1963 E 38th St Oakland, CA 94602
Glenview NeighborhoodEstimated Value: $748,000 - $1,047,041
2
Beds
2
Baths
800
Sq Ft
$1,143/Sq Ft
Est. Value
About This Home
This home is located at 1963 E 38th St, Oakland, CA 94602 and is currently estimated at $914,510, approximately $1,143 per square foot. 1963 E 38th St is a home located in Alameda County with nearby schools including Glenview Elementary School, Edna Brewer Middle School, and Oakland High School.
Ownership History
Date
Name
Owned For
Owner Type
Purchase Details
Closed on
Nov 4, 2016
Sold by
Rokeach Chad Alan and The Chad Alan Rokeach Living
Bought by
Hodges Rutlandra K and Washington Franklyn D
Current Estimated Value
Home Financials for this Owner
Home Financials are based on the most recent Mortgage that was taken out on this home.
Original Mortgage
$480,000
Outstanding Balance
$386,084
Interest Rate
3.48%
Mortgage Type
New Conventional
Estimated Equity
$528,426
Purchase Details
Closed on
Mar 4, 2015
Sold by
Rokeach Chad Alan
Bought by
Rokeach Chad Alan and The Chad Alan Rokeach Living T
Purchase Details
Closed on
Mar 6, 2014
Sold by
Rokeach Chad Alan and The Chad Alan Rokeach Living
Bought by
Rokeach Chad Alan
Home Financials for this Owner
Home Financials are based on the most recent Mortgage that was taken out on this home.
Original Mortgage
$380,000
Interest Rate
3.61%
Mortgage Type
New Conventional
Purchase Details
Closed on
Feb 4, 2008
Sold by
Residential Funding Co Llc
Bought by
Rokeach Chad
Purchase Details
Closed on
Mar 29, 2007
Sold by
Wmc Mortgage Corp
Bought by
Residential Funding Co Llc
Purchase Details
Closed on
Mar 26, 2007
Sold by
Morgan Stanley Mortgage Capital Inc
Bought by
Wmc Mortgage Corp
Purchase Details
Closed on
Oct 2, 2006
Sold by
Lover Stephen
Bought by
Morgan Stanley Mortgage Capital Inc
Purchase Details
Closed on
Dec 19, 2005
Sold by
Thompson Marsha
Bought by
Lover Stephen
Home Financials for this Owner
Home Financials are based on the most recent Mortgage that was taken out on this home.
Original Mortgage
$588,000
Interest Rate
8.5%
Mortgage Type
Fannie Mae Freddie Mac
Purchase Details
Closed on
Feb 15, 2005
Sold by
Lane Sherry
Bought by
Thompson Marsha
Home Financials for this Owner
Home Financials are based on the most recent Mortgage that was taken out on this home.
Original Mortgage
$416,000
Interest Rate
6.75%
Mortgage Type
Purchase Money Mortgage
Purchase Details
Closed on
Dec 2, 1999
Sold by
Sung Cheng Wei
Bought by
Lane Sherry
Home Financials for this Owner
Home Financials are based on the most recent Mortgage that was taken out on this home.
Original Mortgage
$165,000
Interest Rate
7.96%
Purchase Details
Closed on
Mar 25, 1994
Sold by
Sung Cheng Wei
Bought by
Lane Sherry
Purchase Details
Closed on
Dec 21, 1993
Sold by
Yeung Po Yin
Bought by
Lane Sherry
Purchase Details
Closed on
Sep 24, 1993
Sold by
Morlino Maria
Bought by
Morlino Boris
Create a Home Valuation Report for This Property
The Home Valuation Report is an in-depth analysis detailing your home's value as well as a comparison with similar homes in the area
Home Values in the Area
Average Home Value in this Area
Purchase History
| Date | Buyer | Sale Price | Title Company |
|---|---|---|---|
| Hodges Rutlandra K | $600,000 | Chicago Title Company | |
| Rokeach Chad Alan | -- | Old Republic Title Company | |
| Rokeach Chad Alan | -- | Old Republic Title Company | |
| Rokeach Chad Alan | -- | None Available | |
| Rokeach Chad | $265,000 | Lawyers Title Co | |
| Residential Funding Co Llc | -- | First American Title | |
| Wmc Mortgage Corp | -- | First American Title | |
| Morgan Stanley Mortgage Capital Inc | $631,743 | First American Title | |
| Lover Stephen | $735,000 | Alliance Title Company | |
| Thompson Marsha | $520,000 | Chicago Title Co | |
| Lane Sherry | -- | Fidelity National Title Co | |
| Lane Sherry | -- | -- | |
| Lane Sherry | -- | -- | |
| Morlino Boris | -- | Stewart Title Company Of Cc |
Source: Public Records
Mortgage History
| Date | Status | Borrower | Loan Amount |
|---|---|---|---|
| Open | Hodges Rutlandra K | $480,000 | |
| Previous Owner | Rokeach Chad Alan | $380,000 | |
| Previous Owner | Lover Stephen | $588,000 | |
| Previous Owner | Thompson Marsha | $416,000 | |
| Previous Owner | Lane Sherry | $165,000 | |
| Closed | Thompson Marsha | $104,000 |
Source: Public Records
Tax History
| Year | Tax Paid | Tax Assessment Tax Assessment Total Assessment is a certain percentage of the fair market value that is determined by local assessors to be the total taxable value of land and additions on the property. | Land | Improvement |
|---|---|---|---|---|
| 2025 | $10,949 | $696,335 | $208,900 | $487,435 |
| 2024 | $10,949 | $682,685 | $204,805 | $477,880 |
| 2023 | $11,460 | $669,300 | $200,790 | $468,510 |
| 2022 | $11,093 | $656,177 | $196,853 | $459,324 |
| 2021 | $10,554 | $643,313 | $192,994 | $450,319 |
| 2020 | $10,437 | $636,720 | $191,016 | $445,704 |
| 2019 | $10,010 | $624,240 | $187,272 | $436,968 |
| 2018 | $9,802 | $612,000 | $183,600 | $428,400 |
| 2017 | $9,404 | $600,000 | $180,000 | $420,000 |
| 2016 | $4,857 | $294,030 | $88,209 | $205,821 |
| 2015 | $4,829 | $289,615 | $86,884 | $202,731 |
| 2014 | $4,827 | $283,944 | $85,183 | $198,761 |
Source: Public Records
Map
Nearby Homes
- 3525 Dimond Ave
- 3927 Canon Ave
- 2257 Macarthur Blvd
- 1515 Hampel St
- 2550 Pleasant St
- 3464 Champion St
- 1524 Hampel St
- 3226 Champion St
- 3220 Champion St
- 3601 Lincoln Ave
- 1424 Hampel St
- 2639 Harold St
- 3862 Lyman Rd
- 2628 School St
- 3425 Wilson Ave
- 2900 Sheffield Ave
- 2596 Macarthur Blvd
- 4033 Park Blvd
- 4037 Park Blvd
- 4426 Park Blvd
- 1963 E 38th St Unit Upper
- 1784 Excelsior Ave
- 1790 Excelsior Ave
- 1798 Excelsior Ave
- 1776 Excelsior Ave
- 1770 Excelsior Ave
- 1957 E 38th St
- 1924 E 38th St
- 3719 Canon Ave
- 1951 E 38th St
- 1764 Excelsior Ave
- 1778 Excelsior Ave
- 1916 E 38th St
- 1771 Evers Ave
- 3725 Canon Ave
- 1763 Evers Ave
- 1908 E 38th St
- 3708 Linwood Ave
- 3714 Linwood Ave
- 3733 Canon Ave
Your Personal Tour Guide
Ask me questions while you tour the home.