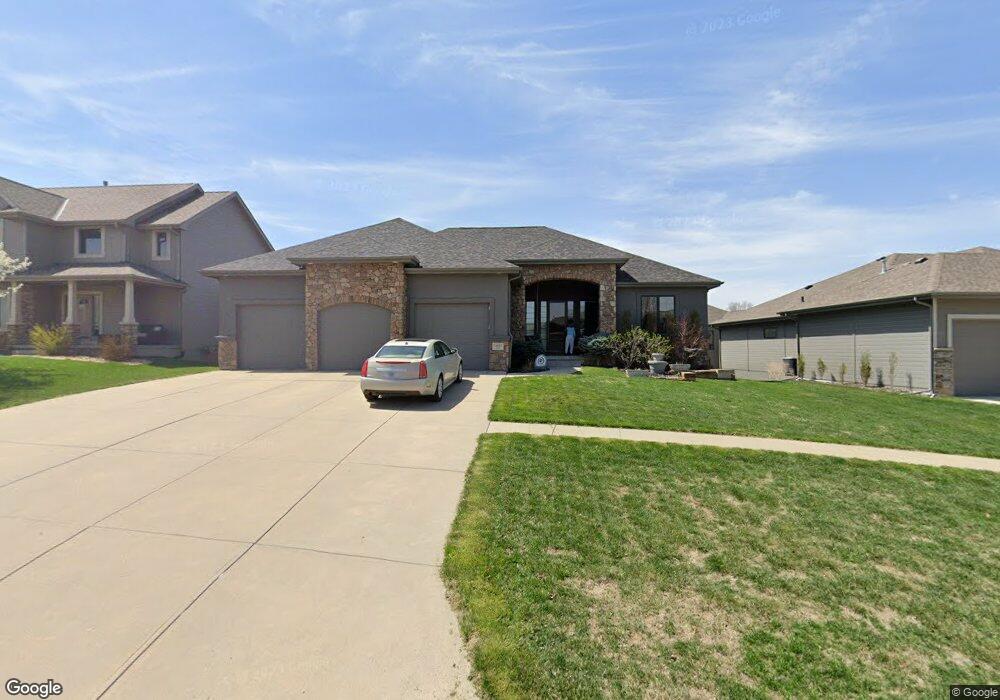
19630 Chandler St Gretna, NE 68028
Estimated Value: $575,000 - $626,000
5
Beds
3
Baths
4,440
Sq Ft
$137/Sq Ft
Est. Value
About This Home
This home is located at 19630 Chandler St, Gretna, NE 68028 and is currently estimated at $606,113, approximately $136 per square foot. 19630 Chandler St is a home located in Sarpy County with nearby schools including Whitetail Creek Elementary School, Gretna Middle School, and Gretna High School.
Ownership History
Date
Name
Owned For
Owner Type
Purchase Details
Closed on
Jul 21, 2025
Sold by
Highley Michael B and Highley Kendra G
Bought by
Highley
Current Estimated Value
Purchase Details
Closed on
Jun 25, 2009
Sold by
R & A Builders Inc
Bought by
Highley Michael B and Highley Kendra G
Home Financials for this Owner
Home Financials are based on the most recent Mortgage that was taken out on this home.
Original Mortgage
$320,000
Interest Rate
4.83%
Purchase Details
Closed on
Mar 5, 2009
Sold by
Shaw Jeff
Bought by
R & A Builders Inc
Purchase Details
Closed on
Jun 9, 2006
Sold by
Bellbrook Development Llc
Bought by
Jeff Shaw Builders Inc
Home Financials for this Owner
Home Financials are based on the most recent Mortgage that was taken out on this home.
Original Mortgage
$300,000
Interest Rate
6.58%
Mortgage Type
Small Business Administration
Create a Home Valuation Report for This Property
The Home Valuation Report is an in-depth analysis detailing your home's value as well as a comparison with similar homes in the area
Home Values in the Area
Average Home Value in this Area
Purchase History
| Date | Buyer | Sale Price | Title Company |
|---|---|---|---|
| Highley | -- | None Listed On Document | |
| Highley Michael B | $456,000 | Clean Title & Escrow Llc | |
| R & A Builders Inc | $37,000 | Clean Title & Escrow Llc | |
| Jeff Shaw Builders Inc | $39,000 | None Available |
Source: Public Records
Mortgage History
| Date | Status | Borrower | Loan Amount |
|---|---|---|---|
| Previous Owner | Highley Michael B | $320,000 | |
| Previous Owner | Jeff Shaw Builders Inc | $300,000 |
Source: Public Records
Tax History Compared to Growth
Tax History
| Year | Tax Paid | Tax Assessment Tax Assessment Total Assessment is a certain percentage of the fair market value that is determined by local assessors to be the total taxable value of land and additions on the property. | Land | Improvement |
|---|---|---|---|---|
| 2025 | $11,440 | $626,875 | $75,000 | $551,875 |
| 2024 | $12,438 | $605,073 | $75,000 | $530,073 |
| 2023 | $12,438 | $548,384 | $62,000 | $486,384 |
| 2022 | $12,141 | $499,070 | $57,000 | $442,070 |
| 2021 | $11,119 | $463,853 | $55,500 | $408,353 |
| 2020 | $11,145 | $458,237 | $55,500 | $402,737 |
| 2019 | $10,493 | $432,298 | $55,500 | $376,798 |
| 2018 | $10,581 | $430,529 | $46,000 | $384,529 |
| 2017 | $10,807 | $425,405 | $46,000 | $379,405 |
| 2016 | $10,834 | $425,533 | $44,000 | $381,533 |
| 2015 | $10,908 | $421,111 | $44,000 | $377,111 |
| 2014 | $10,815 | $407,096 | $44,000 | $363,096 |
| 2012 | -- | $389,943 | $40,000 | $349,943 |
Source: Public Records
Map
Nearby Homes
- 19523 Josephine St
- 19821 Emiline St
- 7819 S 194th Ave
- 19603 Brookside Ln
- 19823 Bellbrook Blvd
- 7112 S 193rd St
- 7710 S 198th St
- 19802 Cottonwood St
- 8004 S 195th St
- 7712 S 199th St
- 19760 Briar St
- 6726 S 198th St
- 7808 S 190 Ave
- 8007 S 198th St
- 18921 Lillian St
- 19965 Polk St
- 20003 Polk St
- 8023 S 193rd St
- 8008 S 200th St
- 20970 Polk St
- 19626 Chandler St
- 19634 Chandler St
- 19658 Chandler St
- 19622 Chandler St
- 19638 Chandler St
- 19662 Chandler St
- 19654 Chandler St
- 19617 Chandler St
- 19609 Chandler St
- 19613 Chandler St
- 7421 S 197 St
- 7421 S 197th St
- 7421 197
- 19621 Chandler St
- 19618 Chandler St
- 19642 Chandler St
- 19650 Chandler St
- 7417 S 197th St
- 19646 Chandler St
- 19625 Chandler St