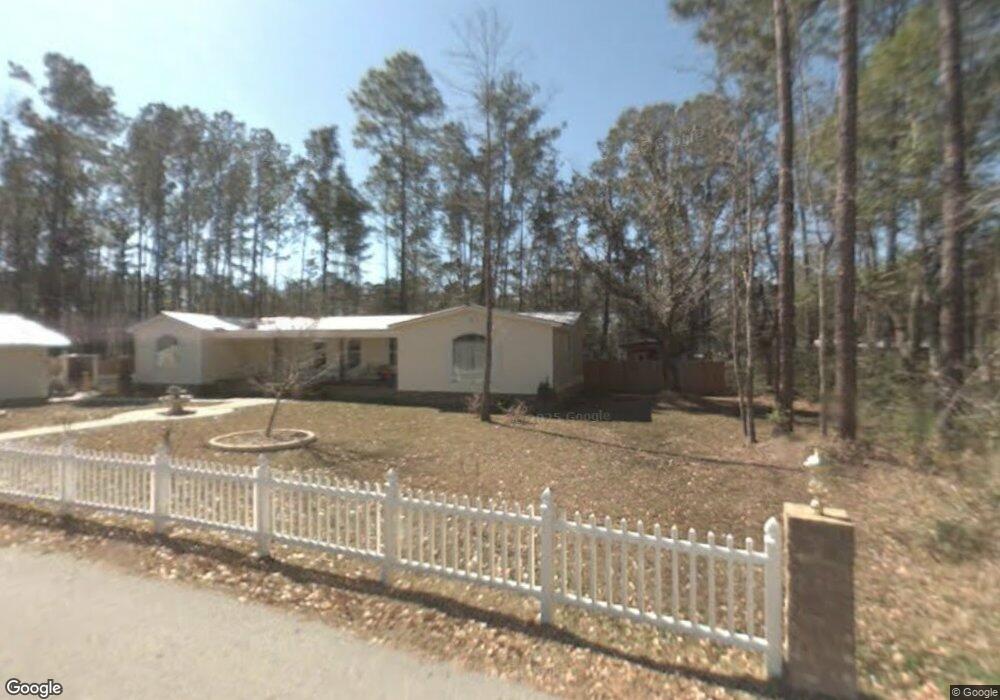
19630 Dobbin Cir Moss Point, MS 39562
Estimated Value: $178,695 - $250,000
Studio
1
Bath
1,564
Sq Ft
$140/Sq Ft
Est. Value
About This Home
This home is located at 19630 Dobbin Cir, Moss Point, MS 39562 and is currently estimated at $218,424, approximately $139 per square foot. 19630 Dobbin Cir is a home located in Jackson County with nearby schools including East Central Lower Elementary School, East Central Upper Elementary School, and East Central Middle School.
Create a Home Valuation Report for This Property
The Home Valuation Report is an in-depth analysis detailing your home's value as well as a comparison with similar homes in the area
Tax History
| Year | Tax Paid | Tax Assessment Tax Assessment Total Assessment is a certain percentage of the fair market value that is determined by local assessors to be the total taxable value of land and additions on the property. | Land | Improvement |
|---|---|---|---|---|
| 2025 | $1,036 | $11,246 | $1,866 | $9,380 |
| 2024 | $1,036 | $9,429 | $1,816 | $7,613 |
| 2023 | $832 | $9,429 | $1,816 | $7,613 |
| 2022 | $800 | $9,429 | $1,816 | $7,613 |
| 2021 | $808 | $9,502 | $1,816 | $7,686 |
| 2020 | $748 | $8,676 | $1,681 | $6,995 |
| 2019 | $737 | $8,676 | $1,681 | $6,995 |
| 2018 | $766 | $8,752 | $1,681 | $7,071 |
| 2017 | $784 | $8,752 | $1,681 | $7,071 |
| 2016 | $741 | $8,752 | $1,681 | $7,071 |
| 2015 | $783 | $90,530 | $16,810 | $73,720 |
| 2014 | $764 | $9,053 | $1,681 | $7,372 |
| 2013 | $728 | $9,053 | $1,681 | $7,372 |
Source: Public Records
Map
Nearby Homes
- 19506 Highway 63
- 19500 Angel Ln
- 20700 Cameron Ln
- 17209 Red Top Ln
- Tbd Hurley Wade Rd
- 5402 Huckleberry Ln
- 3016 Ed Parker Rd
- 21217 E Trails End Rd
- 0 Grafe Homestead Rd Unit 4137349
- 5455 Gavin Hamilton Rd
- 0 Dr Unit 4052148
- 0 River Walk Dr
- 7201 Bentwood Dr
- 0 00 Gavin Hamilton Rd
- 0 Mississippi 614
- 0000 Mississippi 614
- 0 River Place Unit 4143478
- 6685 Caraway Rd
- 0 River Bluffs Lot 33 Dr
- Lot 111 River Place
- 19624 Dobbin Cir
- 19632 Dobbin Cir
- 19600 Robalo Way
- 19600 Robalo Way
- 19625 Robalo Way
- 19617 Robalo Way
- 19638 Robalo Way
- 2506 Hardy Parker Rd
- 19701 Robalo Way
- 2701 Bertha Hanna Rd
- 2504 Hardy Parker
- 2600 Bertha Hanna Rd
- 19705 Robalo Way
- 2700 Goff Rd
- 19537 New Hope Church Rd
- 19541 New Hope Church Rd
- 2425 Hardy Parker
- 2334 Hardy Parker
- 2401 Hardy Parker
- 2513 Hardy Parker
Your Personal Tour Guide
Ask me questions while you tour the home.