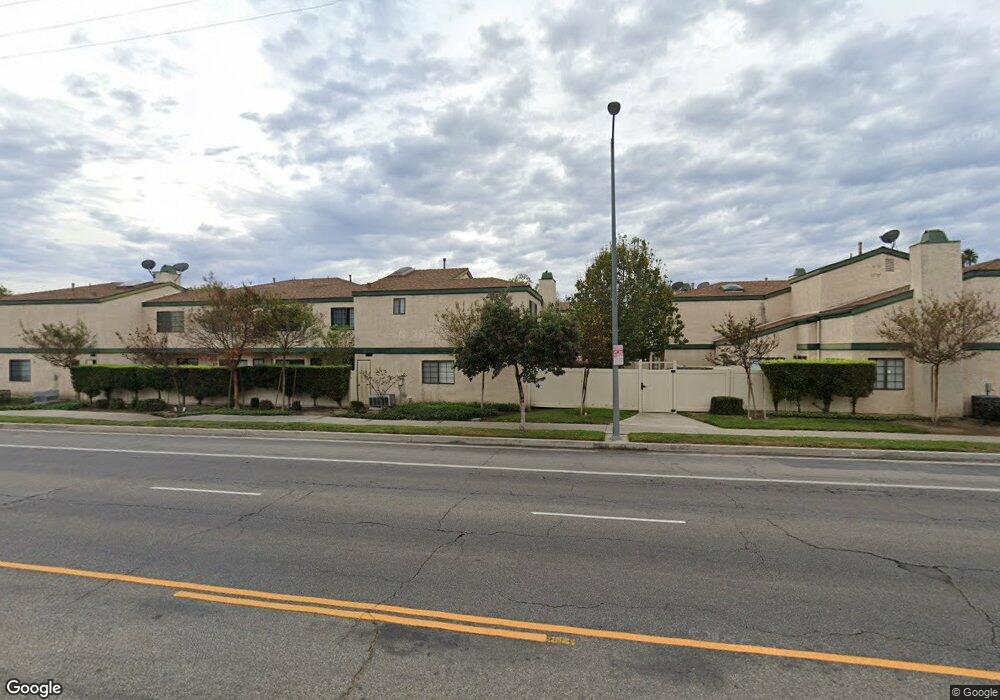
19630 Roscoe Blvd Unit F Northridge, CA 91324
Estimated Value: $531,435 - $587,000
2
Beds
2
Baths
1,260
Sq Ft
$443/Sq Ft
Est. Value
About This Home
This home is located at 19630 Roscoe Blvd Unit F, Northridge, CA 91324 and is currently estimated at $558,609, approximately $443 per square foot. 19630 Roscoe Blvd Unit F is a home located in Los Angeles County with nearby schools including Melvin Avenue Elementary School, John A. Sutter Middle School, and Northridge Academy High.
Ownership History
Date
Name
Owned For
Owner Type
Purchase Details
Closed on
Dec 17, 2001
Sold by
Berman Amy Jo
Bought by
Healy Derek J
Current Estimated Value
Home Financials for this Owner
Home Financials are based on the most recent Mortgage that was taken out on this home.
Original Mortgage
$150,100
Outstanding Balance
$57,912
Interest Rate
6.4%
Mortgage Type
Stand Alone First
Estimated Equity
$500,697
Purchase Details
Closed on
Dec 5, 2001
Sold by
Cetto Carlos
Bought by
Healy Derek J
Home Financials for this Owner
Home Financials are based on the most recent Mortgage that was taken out on this home.
Original Mortgage
$150,100
Outstanding Balance
$57,912
Interest Rate
6.4%
Mortgage Type
Stand Alone First
Estimated Equity
$500,697
Purchase Details
Closed on
Feb 10, 1997
Sold by
Cetto Carlos
Bought by
Cetto Georgina J
Create a Home Valuation Report for This Property
The Home Valuation Report is an in-depth analysis detailing your home's value as well as a comparison with similar homes in the area
Home Values in the Area
Average Home Value in this Area
Purchase History
| Date | Buyer | Sale Price | Title Company |
|---|---|---|---|
| Healy Derek J | -- | First American Title Co | |
| Healy Derek J | $158,000 | First American Title Co | |
| Cetto Georgina J | -- | -- |
Source: Public Records
Mortgage History
| Date | Status | Borrower | Loan Amount |
|---|---|---|---|
| Open | Healy Derek J | $150,100 |
Source: Public Records
Tax History Compared to Growth
Tax History
| Year | Tax Paid | Tax Assessment Tax Assessment Total Assessment is a certain percentage of the fair market value that is determined by local assessors to be the total taxable value of land and additions on the property. | Land | Improvement |
|---|---|---|---|---|
| 2025 | $2,939 | $233,386 | $96,454 | $136,932 |
| 2024 | $2,939 | $228,811 | $94,563 | $134,248 |
| 2023 | $2,885 | $224,325 | $92,709 | $131,616 |
| 2022 | $2,754 | $219,928 | $90,892 | $129,036 |
| 2021 | $2,714 | $215,616 | $89,110 | $126,506 |
| 2019 | $2,634 | $209,222 | $86,468 | $122,754 |
| 2018 | $2,576 | $205,121 | $84,773 | $120,348 |
| 2016 | $2,450 | $197,158 | $81,482 | $115,676 |
| 2015 | $2,415 | $194,198 | $80,259 | $113,939 |
| 2014 | $2,429 | $190,395 | $78,687 | $111,708 |
Source: Public Records
Map
Nearby Homes
- 8359 Melvin Ave
- 8433 Melvin Ave
- 19709 Strathern St
- 8366 Oakdale Ave
- 19910 Cantara St
- 8509 Shirley Ave
- 19516 Blythe St
- 19931 Lanark St
- 8348 Penfield Ave Unit 3
- 19935 Lanark St
- 8450 Calvin Ave
- 19947 Cantara St
- 19426 Blythe St
- 8529 Tunney Ave
- 19928 Chase St Unit 2
- 19222 Roscoe Blvd
- 19545 Bryant St
- 8467 Penfield Ave
- 8125 Quakertown Ave
- 19158 Roscoe Blvd
- 19614 Roscoe Blvd Unit C
- 19620 Roscoe Blvd Unit A
- 19614 Roscoe Blvd Unit 26
- 19654 Roscoe Blvd Unit C
- 19654 Roscoe Blvd Unit B
- 19654 Roscoe Blvd Unit A
- 19644 Roscoe Blvd Unit B
- 19620 Roscoe Blvd Unit B
- 19620 Roscoe Blvd Unit A
- 19630 Roscoe Blvd Unit E
- 19630 Roscoe Blvd Unit D
- 19630 Roscoe Blvd Unit C
- 19630 Roscoe Blvd Unit B
- 19630 Roscoe Blvd Unit A
- 19650 Roscoe Blvd Unit D
- 19650 Roscoe Blvd Unit C
- 19650 Roscoe Blvd Unit B
- 19650 Roscoe Blvd Unit A
- 19660 Roscoe Blvd Unit B
- 19660 Roscoe Blvd Unit A