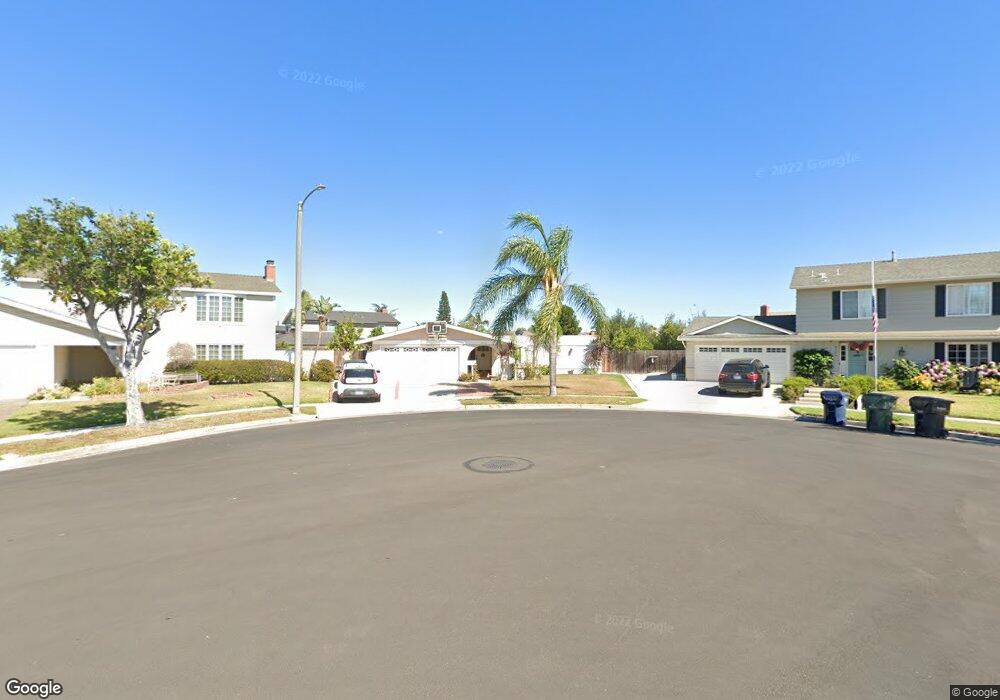
19632 Rumsey Ln Huntington Beach, CA 92646
Estimated Value: $1,421,984 - $1,472,000
3
Beds
2
Baths
1,837
Sq Ft
$788/Sq Ft
Est. Value
About This Home
This home is located at 19632 Rumsey Ln, Huntington Beach, CA 92646 and is currently estimated at $1,446,996, approximately $787 per square foot. 19632 Rumsey Ln is a home located in Orange County with nearby schools including William T. Newland Elementary, Talbert Middle School, and Huntington Beach High School.
Ownership History
Date
Name
Owned For
Owner Type
Purchase Details
Closed on
Apr 17, 2001
Sold by
Kos Philip M and Kos Melanie A
Bought by
Kos Philip M and Kos Melanie
Current Estimated Value
Home Financials for this Owner
Home Financials are based on the most recent Mortgage that was taken out on this home.
Original Mortgage
$273,750
Outstanding Balance
$100,163
Interest Rate
6.92%
Estimated Equity
$1,346,833
Purchase Details
Closed on
Jun 6, 2000
Sold by
Philip Kos and Philip Melanie
Bought by
Kos Philip M and Kos Melanie A
Purchase Details
Closed on
Dec 1, 1994
Sold by
Jones John Robert and Jones Barbara
Bought by
Kos Philip and Kos Melanie
Home Financials for this Owner
Home Financials are based on the most recent Mortgage that was taken out on this home.
Original Mortgage
$202,500
Interest Rate
6.25%
Purchase Details
Closed on
Sep 16, 1993
Sold by
First American Trust Company
Bought by
Jones John Robert and Jones Barbara
Create a Home Valuation Report for This Property
The Home Valuation Report is an in-depth analysis detailing your home's value as well as a comparison with similar homes in the area
Home Values in the Area
Average Home Value in this Area
Purchase History
| Date | Buyer | Sale Price | Title Company |
|---|---|---|---|
| Kos Philip M | -- | American Title Co | |
| Kos Philip M | -- | -- | |
| Kos Philip | $226,500 | Continental Lawyers Title Co | |
| Jones John Robert | $5,500 | First American Title Insuran |
Source: Public Records
Mortgage History
| Date | Status | Borrower | Loan Amount |
|---|---|---|---|
| Open | Kos Philip M | $273,750 | |
| Previous Owner | Kos Philip | $202,500 |
Source: Public Records
Tax History Compared to Growth
Tax History
| Year | Tax Paid | Tax Assessment Tax Assessment Total Assessment is a certain percentage of the fair market value that is determined by local assessors to be the total taxable value of land and additions on the property. | Land | Improvement |
|---|---|---|---|---|
| 2025 | $4,784 | $417,158 | $276,537 | $140,621 |
| 2024 | $4,784 | $408,979 | $271,115 | $137,864 |
| 2023 | $4,670 | $400,960 | $265,799 | $135,161 |
| 2022 | $4,598 | $393,099 | $260,588 | $132,511 |
| 2021 | $4,509 | $385,392 | $255,479 | $129,913 |
| 2020 | $4,481 | $381,441 | $252,860 | $128,581 |
| 2019 | $4,391 | $373,962 | $247,902 | $126,060 |
| 2018 | $4,307 | $366,630 | $243,041 | $123,589 |
| 2017 | $4,238 | $359,442 | $238,276 | $121,166 |
| 2016 | $4,059 | $352,395 | $233,604 | $118,791 |
| 2015 | $3,996 | $347,102 | $230,095 | $117,007 |
| 2014 | $3,916 | $340,303 | $225,588 | $114,715 |
Source: Public Records
Map
Nearby Homes
- 9121 Madeline Dr
- 9172 Veronica Dr
- 19846 Lures Ln
- 19202 Hickory Ln
- 9594 Pettswood Dr Unit 4
- 20071 Moontide Cir
- 19854 Leighton Ln
- 9667 Durham Dr
- 9462 Litchfield Dr
- 8582 Salt Lake Dr
- 9695 Adams Ave
- 9745 Cornwall Dr
- 20258 Lantana Dr
- 19843 Coventry Ln
- 9831 Continental Dr
- 19860 Claremont Ln
- 20131 Crown Reef Ln
- 9522 Yellowstone Dr
- 19774 Cambridge Ln
- 19361 Brookhurst St Unit 159
- 9162 Elva Cir
- 19622 Rumsey Ln
- 19631 Occidental Ln
- 19641 Occidental Ln
- 19621 Occidental Ln
- 9161 Madeline Dr
- 9171 Madeline Dr
- 9151 Madeline Dr
- 19612 Rumsey Ln
- 9152 Elva Cir
- 9191 Madeline Dr
- 19611 Occidental Ln
- 9141 Madeline Dr
- 19602 Rumsey Ln
- 19621 Rumsey Ln
- 9142 Elva Cir
- 19601 Occidental Ln
- 9131 Madeline Dr
- 19642 Occidental Ln
- 19611 Rumsey Ln