19639 Gallagher St Unit Bldg-Unit Detroit, MI 48234
Pershing NeighborhoodEstimated Value: $61,000 - $89,000
3
Beds
1
Bath
1,101
Sq Ft
$68/Sq Ft
Est. Value
About This Home
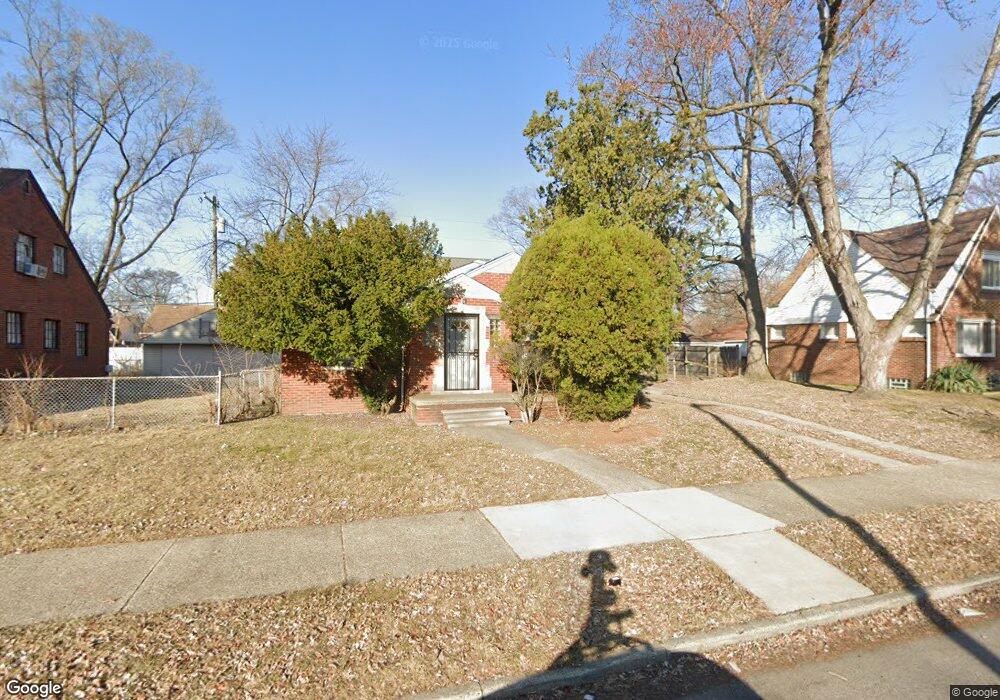
This home is located at 19639 Gallagher St Unit Bldg-Unit, Detroit, MI 48234 and is currently estimated at $74,672, approximately $67 per square foot. 19639 Gallagher St Unit Bldg-Unit is a home located in Wayne County with nearby schools including Mason Academy, Edward 'Duke' Ellington Conservatory of Music and Art, and Charles L. Spain Elementary-Middle School.
Ownership History
Date
Name
Owned For
Owner Type
Purchase Details
Closed on
Mar 26, 2025
Sold by
United Community Housing Coalition
Bought by
Shahid Abdur
Current Estimated Value
Purchase Details
Closed on
Feb 12, 2025
Sold by
City Of Detroit
Bought by
United Community Housing Coalition
Purchase Details
Closed on
Aug 20, 2024
Sold by
Wayne County Treasurer
Bought by
City Of Detroit Planning And Development Depa
Purchase Details
Closed on
Feb 25, 2019
Sold by
Dtroit 2L Proeprties Llc
Bought by
Cyann Immobilier Llc
Purchase Details
Closed on
Feb 5, 2018
Sold by
Davis Casidah
Bought by
Detroit 2L Properties Llc
Purchase Details
Closed on
Nov 11, 2014
Sold by
Treasurer Of The Charter County Of Wayne
Bought by
Davis Casidah
Purchase Details
Closed on
Sep 19, 2002
Sold by
Halny Nina
Bought by
Halny Peter
Create a Home Valuation Report for This Property
The Home Valuation Report is an in-depth analysis detailing your home's value as well as a comparison with similar homes in the area
Home Values in the Area
Average Home Value in this Area
Purchase History
| Date | Buyer | Sale Price | Title Company |
|---|---|---|---|
| Shahid Abdur | -- | None Listed On Document | |
| United Community Housing Coalition | $103,898 | None Listed On Document | |
| United Community Housing Coalition | $103,898 | None Listed On Document | |
| City Of Detroit Planning And Development Depa | $6,446 | None Listed On Document | |
| City Of Detroit Planning And Development Depa | $6,446 | None Listed On Document | |
| Cyann Immobilier Llc | $54,000 | First American Title Ins Co | |
| Detroit 2L Properties Llc | $28,000 | First American Title Ins Co | |
| Davis Casidah | $3,102 | None Available | |
| Halny Peter | -- | -- |
Source: Public Records
Tax History Compared to Growth
Tax History
| Year | Tax Paid | Tax Assessment Tax Assessment Total Assessment is a certain percentage of the fair market value that is determined by local assessors to be the total taxable value of land and additions on the property. | Land | Improvement |
|---|---|---|---|---|
| 2025 | $1,398 | $0 | $0 | $0 |
| 2024 | $1,398 | $28,100 | $0 | $0 |
| 2023 | $1,357 | $22,500 | $0 | $0 |
| 2022 | $1,448 | $19,200 | $0 | $0 |
| 2021 | $1,408 | $15,300 | $0 | $0 |
| 2020 | $1,408 | $13,200 | $0 | $0 |
| 2019 | $1,369 | $10,500 | $0 | $0 |
| 2018 | $795 | $9,600 | $0 | $0 |
| 2017 | $134 | $8,000 | $0 | $0 |
| 2016 | $863 | $25,600 | $0 | $0 |
| 2015 | $1,490 | $14,900 | $0 | $0 |
| 2013 | $2,405 | $24,047 | $0 | $0 |
| 2010 | -- | $35,256 | $2,044 | $33,212 |
Source: Public Records
Map
Nearby Homes
- 19665 Charest St
- 19426 Charest St
- 19428 Gallagher St
- 19721 Klinger St
- 19400 Charest St
- 19629 Harned St
- 19384 Harned St
- 19660 Norwood St
- 19624 Anglin St
- 19948 Mitchell St
- 19958 Harned St
- 19250 Charest St
- 19444 Yonka St
- 19311 Norwood St
- 19942 Norwood St
- 19403 Anglin St
- 19626 Mackay St
- 20028 Gallagher St
- 19238 Mitchell St
- 20037 Gallagher St
- 19639 Gallagher St
- 19651 Gallagher St
- 19625 Gallagher St
- 19657 Gallagher St
- 19663 Gallagher St
- 19615 Gallagher St
- 19648 Charest St
- 19632 Charest St
- 19656 Charest St
- 19669 Gallagher St
- 19640 Gallagher St
- 19648 Gallagher St
- 19607 Gallagher St
- 19632 Gallagher St
- 19662 Charest St
- 19656 Gallagher St
- 19626 Gallagher St
- 19614 Charest St
- 19668 Charest St
- 19601 Gallagher St