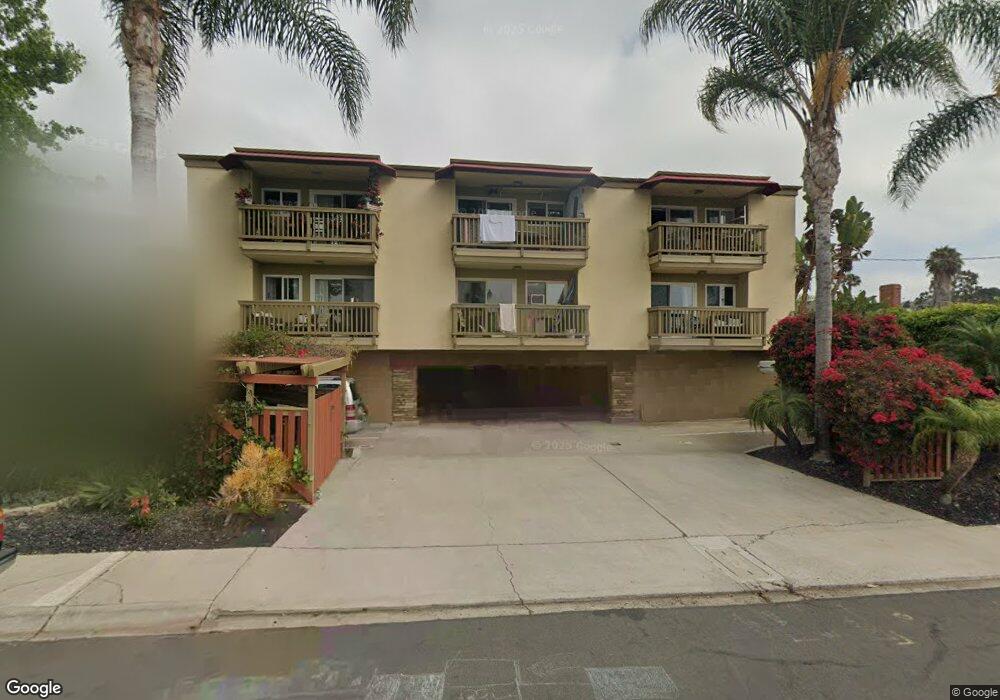
1964 Chalcedony St Unit 10 San Diego, CA 92109
Pacific Beach NeighborhoodEstimated Value: $499,000 - $590,000
1
Bed
1
Bath
649
Sq Ft
$833/Sq Ft
Est. Value
About This Home
This home is located at 1964 Chalcedony St Unit 10, San Diego, CA 92109 and is currently estimated at $540,803, approximately $833 per square foot. 1964 Chalcedony St Unit 10 is a home located in San Diego County with nearby schools including Sessions Elementary School, Pacific Beach Middle, and Mission Bay High School.
Ownership History
Date
Name
Owned For
Owner Type
Purchase Details
Closed on
Nov 4, 2010
Sold by
Fannie Mae
Bought by
Allen Mark
Current Estimated Value
Home Financials for this Owner
Home Financials are based on the most recent Mortgage that was taken out on this home.
Original Mortgage
$172,000
Outstanding Balance
$113,830
Interest Rate
4.33%
Mortgage Type
New Conventional
Estimated Equity
$426,973
Purchase Details
Closed on
May 5, 2010
Sold by
Johnson Wade
Bought by
Federal National Mortgage Association
Purchase Details
Closed on
Dec 6, 2004
Sold by
Buckingham Equities Vi Llc
Bought by
Johnson Wade
Home Financials for this Owner
Home Financials are based on the most recent Mortgage that was taken out on this home.
Original Mortgage
$286,000
Interest Rate
5.75%
Mortgage Type
Unknown
Create a Home Valuation Report for This Property
The Home Valuation Report is an in-depth analysis detailing your home's value as well as a comparison with similar homes in the area
Home Values in the Area
Average Home Value in this Area
Purchase History
| Date | Buyer | Sale Price | Title Company |
|---|---|---|---|
| Allen Mark | $215,000 | Old Republic Title Company | |
| Federal National Mortgage Association | $306,331 | Landsafe Title | |
| Johnson Wade | $357,500 | First American Title |
Source: Public Records
Mortgage History
| Date | Status | Borrower | Loan Amount |
|---|---|---|---|
| Open | Allen Mark | $172,000 | |
| Previous Owner | Johnson Wade | $286,000 | |
| Closed | Johnson Wade | $71,500 |
Source: Public Records
Tax History Compared to Growth
Tax History
| Year | Tax Paid | Tax Assessment Tax Assessment Total Assessment is a certain percentage of the fair market value that is determined by local assessors to be the total taxable value of land and additions on the property. | Land | Improvement |
|---|---|---|---|---|
| 2025 | $3,262 | $275,441 | $198,576 | $76,865 |
| 2024 | $3,262 | $270,041 | $194,683 | $75,358 |
| 2023 | $3,188 | $264,747 | $190,866 | $73,881 |
| 2022 | $3,102 | $259,557 | $187,124 | $72,433 |
| 2021 | $3,080 | $254,468 | $183,455 | $71,013 |
| 2020 | $3,042 | $251,859 | $181,574 | $70,285 |
| 2019 | $2,986 | $246,921 | $178,014 | $68,907 |
| 2018 | $2,791 | $242,080 | $174,524 | $67,556 |
| 2017 | $80 | $237,334 | $171,102 | $66,232 |
| 2016 | $2,678 | $232,682 | $167,748 | $64,934 |
| 2015 | $2,638 | $229,188 | $165,229 | $63,959 |
| 2014 | $2,595 | $224,700 | $161,993 | $62,707 |
Source: Public Records
Map
Nearby Homes
- 2002 Missouri St Unit 6
- 4804 Lamont St
- 4750 Noyes St Unit 110
- 2020 Diamond St Unit 12
- 1978 Beryl St
- 4730 Noyes St Unit 106
- 1981 Wilbur Ave
- 2128 Missouri St
- 1828 Diamond St Unit 3
- 2036-38 Emerald St
- 4600 Lamont St Unit 4-103
- 1897 Malden St
- 2045 Emerald St Unit 3
- 1855 Diamond St Unit 201
- 1775 Diamond St Unit 220
- 1855 Diamond St Unit 5-309
- 1855 Diamond St Unit 228
- 1885 Diamond St Unit 133
- 1885 Diamond St Unit 2-235
- 1885 Diamond St Unit 2-234
- 1964 Chalcedony St Unit 12
- 1964 Chalcedony St Unit 11
- 1964 Chalcedony St Unit 9
- 1964 Chalcedony St Unit 8
- 1964 Chalcedony St Unit 7
- 1964 Chalcedony St Unit 6
- 1964 Chalcedony St Unit 5
- 1964 Chalcedony St Unit 4
- 1964 Chalcedony St Unit 3
- 1964 Chalcedony St Unit 2
- 1964 Chalcedony St Unit 1
- 1771 Chalcedony St
- 1972 Chalcedony St
- 1952 Chalcedony St Unit 54
- 1980 Chalcedony St
- 1944 Chalcedony St
- 1965 Law St
- 1955 Law St
- 1973 Law St
- 1947 Law St