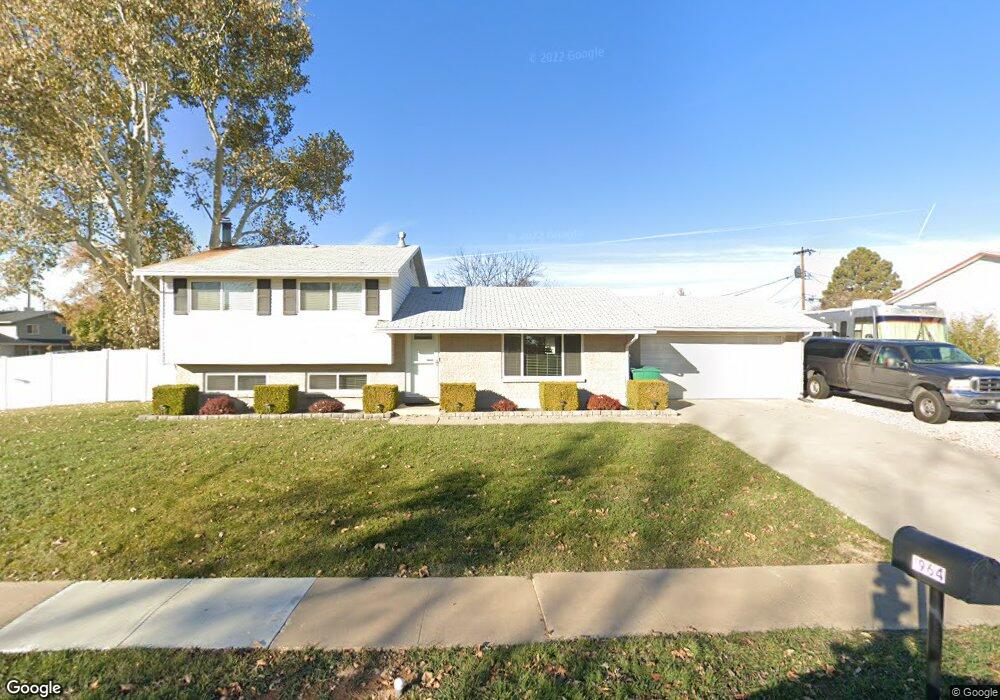
1964 John St Layton, UT 84041
Estimated Value: $389,000 - $406,514
3
Beds
2
Baths
1,180
Sq Ft
$337/Sq Ft
Est. Value
About This Home
This home is located at 1964 John St, Layton, UT 84041 and is currently estimated at $398,129, approximately $337 per square foot. 1964 John St is a home located in Davis County with nearby schools including Vae View Elementary School, Central Davis Junior High School, and Layton High School.
Ownership History
Date
Name
Owned For
Owner Type
Purchase Details
Closed on
Jul 22, 2021
Sold by
Watt Barbara B and Watt Paul
Bought by
Watt Chad and The Watt Investment Trust
Current Estimated Value
Purchase Details
Closed on
Oct 19, 2020
Sold by
Nall Harold E and Nall Karen L
Bought by
Nall Harold and Nall Karen
Home Financials for this Owner
Home Financials are based on the most recent Mortgage that was taken out on this home.
Original Mortgage
$148,000
Outstanding Balance
$131,398
Interest Rate
2.8%
Mortgage Type
New Conventional
Estimated Equity
$266,731
Purchase Details
Closed on
Jul 13, 2017
Sold by
Nall Harold and Nall Karen
Bought by
Nall Karen
Purchase Details
Closed on
Sep 13, 2007
Sold by
Nall Harold and Nall Karen
Bought by
Nall Karen L and Nall Harold E
Home Financials for this Owner
Home Financials are based on the most recent Mortgage that was taken out on this home.
Original Mortgage
$145,800
Interest Rate
6.67%
Mortgage Type
New Conventional
Create a Home Valuation Report for This Property
The Home Valuation Report is an in-depth analysis detailing your home's value as well as a comparison with similar homes in the area
Home Values in the Area
Average Home Value in this Area
Purchase History
| Date | Buyer | Sale Price | Title Company |
|---|---|---|---|
| Watt Chad | -- | Lincoln Title Insurance | |
| Nall Harold | -- | Title Guarantee Layton | |
| Nail Harold | -- | Title Guarantee | |
| Nall Karen | -- | -- | |
| Nall Karen L | -- | Security Title |
Source: Public Records
Mortgage History
| Date | Status | Borrower | Loan Amount |
|---|---|---|---|
| Open | Nail Harold | $148,000 | |
| Previous Owner | Nall Karen L | $145,800 |
Source: Public Records
Tax History Compared to Growth
Tax History
| Year | Tax Paid | Tax Assessment Tax Assessment Total Assessment is a certain percentage of the fair market value that is determined by local assessors to be the total taxable value of land and additions on the property. | Land | Improvement |
|---|---|---|---|---|
| 2025 | $1,981 | $207,900 | $99,966 | $107,934 |
| 2024 | $1,945 | $205,700 | $119,331 | $86,369 |
| 2023 | $1,872 | $349,000 | $154,597 | $194,403 |
| 2022 | $2,054 | $207,900 | $72,703 | $135,197 |
| 2021 | $1,862 | $281,000 | $103,727 | $177,273 |
| 2020 | $1,547 | $224,000 | $76,546 | $147,454 |
| 2019 | $1,530 | $217,000 | $73,604 | $143,396 |
| 2018 | $1,334 | $190,000 | $68,152 | $121,848 |
| 2016 | $1,165 | $85,581 | $19,498 | $66,083 |
| 2015 | $1,119 | $78,046 | $19,498 | $58,548 |
| 2014 | $1,124 | $80,110 | $19,498 | $60,612 |
| 2013 | -- | $75,169 | $20,680 | $54,489 |
Source: Public Records
Map
Nearby Homes
- 1740 N Gregory Dr
- 1954 Ann St
- 1916 W Gregory Dr
- 1992 W Afton Cir
- 1937 W 1620 N
- 1596 N Main St Unit 2
- 1430 N 2100 W
- 1900 N 1690 W
- 1476 N 1875 W Unit 164
- 1491 N 1875 W
- 1491 N 1875 W Unit 158
- 1487 N 1875 W
- 1487 N 1875 W Unit 159
- 1483 N 1875 W
- 1479 N 1875 W
- 1479 N 1875 W Unit 161
- 1463 N 1875 W Unit 165
- 1463 N 1875 W
- 1459 N 1875 W
- 1459 N 1875 W Unit 166
- 1820 N Gregory Dr
- 1946 John St
- 1953 John St
- 1959 Ann St
- 1932 John St
- 1761 N Gregory Dr
- 1785 N Gregory Dr
- 1947 Ann St
- 1749 N Gregory Dr
- 1937 John St
- 1811 N Mark St
- 1741 N Gregory Dr
- 1730 N Gregory Dr
- 1918 John St
- 1821 N Gregory Dr
- 1917 Ann St
- 1923 John St
- 1766 N Afton Cir
- 1823 N Gregory Dr
- 1782 N Afton Cir