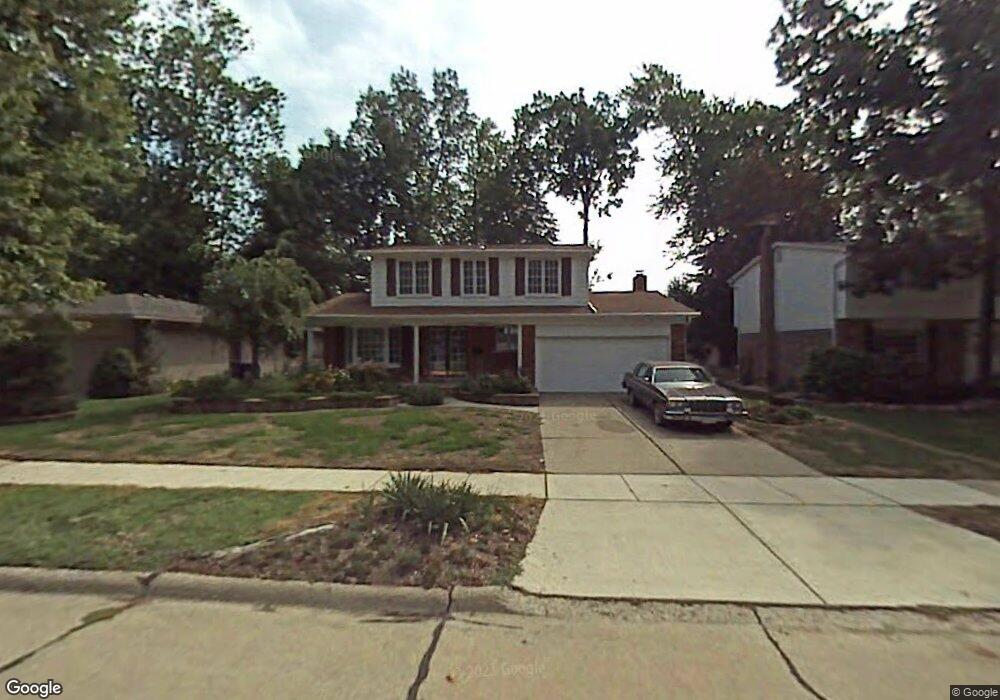
19643 Brandywine St Unit Bldg-Unit Riverview, MI 48193
Estimated Value: $325,000 - $355,000
Studio
3
Baths
1,813
Sq Ft
$186/Sq Ft
Est. Value
About This Home
This home is located at 19643 Brandywine St Unit Bldg-Unit, Riverview, MI 48193 and is currently estimated at $337,332, approximately $186 per square foot. 19643 Brandywine St Unit Bldg-Unit is a home located in Wayne County with nearby schools including Riverview Community High School, St. Cyprian Elementary School, and St. Joseph Elementary School.
Ownership History
Date
Name
Owned For
Owner Type
Purchase Details
Closed on
Mar 9, 2023
Sold by
Leon Gustavo
Bought by
Delaney Brenden
Current Estimated Value
Home Financials for this Owner
Home Financials are based on the most recent Mortgage that was taken out on this home.
Original Mortgage
$280,330
Outstanding Balance
$272,151
Interest Rate
6.73%
Estimated Equity
$65,181
Purchase Details
Closed on
Jul 17, 2018
Sold by
Rouble Nancy
Bought by
Leon Gustavo and Santos Sabrina
Purchase Details
Closed on
Dec 21, 2009
Sold by
Rouble Ambrose J and Rouble Nancy
Bought by
Rouble Ambrose J and Ambrose J Rouble Revocable Living Trust
Create a Home Valuation Report for This Property
The Home Valuation Report is an in-depth analysis detailing your home's value as well as a comparison with similar homes in the area
Home Values in the Area
Average Home Value in this Area
Purchase History
| Date | Buyer | Sale Price | Title Company |
|---|---|---|---|
| Delaney Brenden | $289,000 | -- | |
| Leon Gustavo | $173,000 | First American Title Ins Co | |
| Rouble Ambrose J | -- | None Available |
Source: Public Records
Mortgage History
| Date | Status | Borrower | Loan Amount |
|---|---|---|---|
| Open | Delaney Brenden | $280,330 |
Source: Public Records
Tax History
| Year | Tax Paid | Tax Assessment Tax Assessment Total Assessment is a certain percentage of the fair market value that is determined by local assessors to be the total taxable value of land and additions on the property. | Land | Improvement |
|---|---|---|---|---|
| 2025 | $5,585 | $156,900 | $0 | $0 |
| 2024 | $5,687 | $148,200 | $0 | $0 |
| 2023 | $4,224 | $134,200 | $0 | $0 |
| 2022 | $5,649 | $122,200 | $0 | $0 |
| 2021 | $5,299 | $109,700 | $0 | $0 |
| 2020 | $5,240 | $110,300 | $0 | $0 |
| 2019 | $5,143 | $102,500 | $0 | $0 |
| 2018 | $2,357 | $94,100 | $0 | $0 |
| 2017 | $1,938 | $91,100 | $0 | $0 |
| 2016 | $3,265 | $79,700 | $0 | $0 |
| 2015 | $6,720 | $81,100 | $0 | $0 |
| 2013 | $6,510 | $67,800 | $0 | $0 |
| 2012 | $3,051 | $68,900 | $20,100 | $48,800 |
Source: Public Records
Map
Nearby Homes
- 13842 Heritage St
- 0000 Fort St
- 20698 Coachwood Rd
- 2501 King Rd
- 18082 Ray St
- 214 Detroit St
- 1726 Fort St Unit 10
- 1740 Fort St Unit 36
- VACANT Sibley Rd
- 18031 Hamann St
- 18055 Hinton St
- 14749 Williamsburg Dr
- 1870 Fort St Unit 1
- 1900 Fort St Unit 3
- 14851 Williamsburg Dr
- 1750 Monticello St Unit 6
- 1700 Monticello St Unit 8
- 000 King Rd
- 2070 Fort St Unit G4
- 1744 Harrison Ave Unit C5
- 19643 Brandywine St
- 19631 Brandywine St
- 19655 Brandywine St
- 19619 Brandywine St
- 19667 Brandywine St
- 19648 Brandywine St
- 19636 Brandywine St
- 19607 Brandywine St
- 19679 Brandywine St
- 19654 Brandywine St
- 19628 Brandywine St
- 13802 Heritage St
- 19616 Brandywine St
- 19805 Brandywine St
- 19604 Brandywine St
- 14043 Tall Oaks Ct
- 19817 Brandywine St
- 13828 Heritage St
- 14057 Tall Oaks Ct
- 13831 Tall Oaks Dr
Your Personal Tour Guide
Ask me questions while you tour the home.