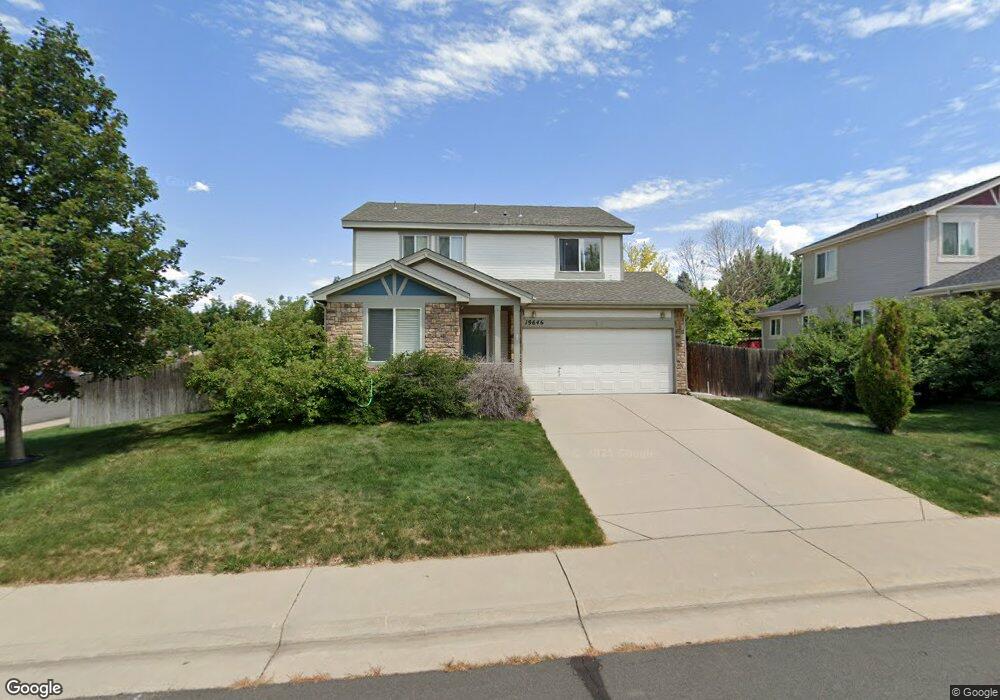
19646 E Caspian Cir Aurora, CO 80013
Sterling Hills NeighborhoodEstimated Value: $527,128 - $562,000
4
Beds
4
Baths
2,169
Sq Ft
$251/Sq Ft
Est. Value
About This Home
This home is located at 19646 E Caspian Cir, Aurora, CO 80013 and is currently estimated at $545,282, approximately $251 per square foot. 19646 E Caspian Cir is a home located in Arapahoe County with nearby schools including Side Creek Elementary School, Mrachek Middle School, and Rangeview High School.
Ownership History
Date
Name
Owned For
Owner Type
Purchase Details
Closed on
Sep 23, 2009
Sold by
Scaggs Christopher E and Scaggs Lucinda Y
Bought by
Zheng Lijun
Current Estimated Value
Home Financials for this Owner
Home Financials are based on the most recent Mortgage that was taken out on this home.
Original Mortgage
$130,000
Outstanding Balance
$84,715
Interest Rate
5.36%
Mortgage Type
New Conventional
Estimated Equity
$460,567
Purchase Details
Closed on
Jul 9, 1999
Sold by
Strauss Homes At Sterling Hill Llc
Bought by
Scaggs Christopher E and Scaggs Lucinda Y
Home Financials for this Owner
Home Financials are based on the most recent Mortgage that was taken out on this home.
Original Mortgage
$175,101
Interest Rate
7.39%
Mortgage Type
FHA
Create a Home Valuation Report for This Property
The Home Valuation Report is an in-depth analysis detailing your home's value as well as a comparison with similar homes in the area
Home Values in the Area
Average Home Value in this Area
Purchase History
| Date | Buyer | Sale Price | Title Company |
|---|---|---|---|
| Zheng Lijun | $185,000 | None Available | |
| Scaggs Christopher E | $176,272 | Land Title |
Source: Public Records
Mortgage History
| Date | Status | Borrower | Loan Amount |
|---|---|---|---|
| Open | Zheng Lijun | $130,000 | |
| Previous Owner | Scaggs Christopher E | $175,101 |
Source: Public Records
Tax History
| Year | Tax Paid | Tax Assessment Tax Assessment Total Assessment is a certain percentage of the fair market value that is determined by local assessors to be the total taxable value of land and additions on the property. | Land | Improvement |
|---|---|---|---|---|
| 2025 | $3,169 | $33,825 | -- | -- |
| 2024 | $3,074 | $33,071 | -- | -- |
| 2023 | $3,074 | $33,071 | $0 | $0 |
| 2022 | $2,847 | $28,350 | $0 | $0 |
| 2021 | $2,938 | $28,350 | $0 | $0 |
| 2020 | $2,880 | $27,664 | $0 | $0 |
| 2019 | $3,059 | $27,664 | $0 | $0 |
| 2018 | $2,887 | $23,717 | $0 | $0 |
| 2017 | $2,561 | $23,717 | $0 | $0 |
| 2016 | $2,439 | $21,595 | $0 | $0 |
| 2015 | $2,369 | $21,595 | $0 | $0 |
| 2014 | $1,722 | $14,694 | $0 | $0 |
| 2013 | -- | $14,710 | $0 | $0 |
Source: Public Records
Map
Nearby Homes
- 25000 E Pacific Dr
- 25020 E Pacific Dr
- 2126 S Espana St
- 19615 E Caspian Cir
- 2029 S Flanders Way Unit C
- 2029 S Flanders Way Unit B
- 2028 S Flanders Way Unit A
- 1949 S Flanders Way Unit B
- 1995 S Espana Ct Unit C
- 1945 S Espana Ct Unit C
- 19268 E Caspian Place
- 19303 E Asbury Dr Unit A
- 19393 E Asbury Dr Unit A
- 19147 E Dickenson Dr
- 2490 S Jebel Way
- 19121 E Pacific Place
- 2430 S Jebel Way
- 20194 E Vassar Ave
- 2082 S Cathay Way
- 19117 E Harvard Dr
- 19644 E Caspian Cir
- 2271 S Fundy Way
- 2291 S Fundy Way
- 19636 E Caspian Cir
- 19645 E Caspian Cir
- 19643 E Caspian Cir
- 19663 E Caspian Cir
- 2313 S Fundy Way
- 19635 E Caspian Cir
- 19634 E Caspian Cir
- 19674 E Caspian Cir
- 19665 E Caspian Cir
- 2212 S Fundy Way
- 2323 S Fundy Way
- 19633 E Caspian Cir
- 2210 S Flanders St
- 2230 S Flanders St
- 19673 E Caspian Cir
- 2232 S Fundy Way
- 19626 E Caspian Cir
Your Personal Tour Guide
Ask me questions while you tour the home.