19646 N Dunlap Rd Dennison, IL 62423
Estimated Value: $275,558 - $346,000
3
Beds
--
Bath
1,708
Sq Ft
$178/Sq Ft
Est. Value
About This Home
This home is located at 19646 N Dunlap Rd, Dennison, IL 62423 and is currently estimated at $304,390, approximately $178 per square foot. 19646 N Dunlap Rd is a home located in Clark County with nearby schools including South Elementary School, North Elementary School, and Marshall Junior High School.
Ownership History
Date
Name
Owned For
Owner Type
Purchase Details
Closed on
Nov 19, 2005
Sold by
Borman Kenneth H and Bormann Elizabeth L
Bought by
Pringle Michael O and Pringle Lora E
Current Estimated Value
Home Financials for this Owner
Home Financials are based on the most recent Mortgage that was taken out on this home.
Original Mortgage
$116,000
Outstanding Balance
$61,917
Interest Rate
5.62%
Mortgage Type
Adjustable Rate Mortgage/ARM
Estimated Equity
$242,473
Create a Home Valuation Report for This Property
The Home Valuation Report is an in-depth analysis detailing your home's value as well as a comparison with similar homes in the area
Home Values in the Area
Average Home Value in this Area
Purchase History
| Date | Buyer | Sale Price | Title Company |
|---|---|---|---|
| Pringle Michael O | $145,000 | None Available |
Source: Public Records
Mortgage History
| Date | Status | Borrower | Loan Amount |
|---|---|---|---|
| Open | Pringle Michael O | $116,000 |
Source: Public Records
Tax History Compared to Growth
Tax History
| Year | Tax Paid | Tax Assessment Tax Assessment Total Assessment is a certain percentage of the fair market value that is determined by local assessors to be the total taxable value of land and additions on the property. | Land | Improvement |
|---|---|---|---|---|
| 2024 | $4,010 | $69,864 | $9,227 | $60,637 |
| 2023 | $3,912 | $69,864 | $9,227 | $60,637 |
| 2022 | $3,712 | $62,378 | $8,238 | $54,140 |
| 2021 | $3,677 | $58,297 | $7,699 | $50,598 |
| 2020 | $3,633 | $58,297 | $7,699 | $50,598 |
| 2019 | $3,633 | $58,297 | $7,699 | $50,598 |
| 2018 | $3,720 | $58,297 | $7,699 | $50,598 |
| 2017 | $3,663 | $57,645 | $5,211 | $52,434 |
| 2016 | $3,885 | $56,365 | $5,095 | $51,270 |
| 2015 | $3,879 | $57,910 | $5,235 | $52,675 |
| 2014 | $3,480 | $54,730 | $4,950 | $49,780 |
| 2013 | $3,480 | $54,130 | $4,785 | $49,345 |
Source: Public Records
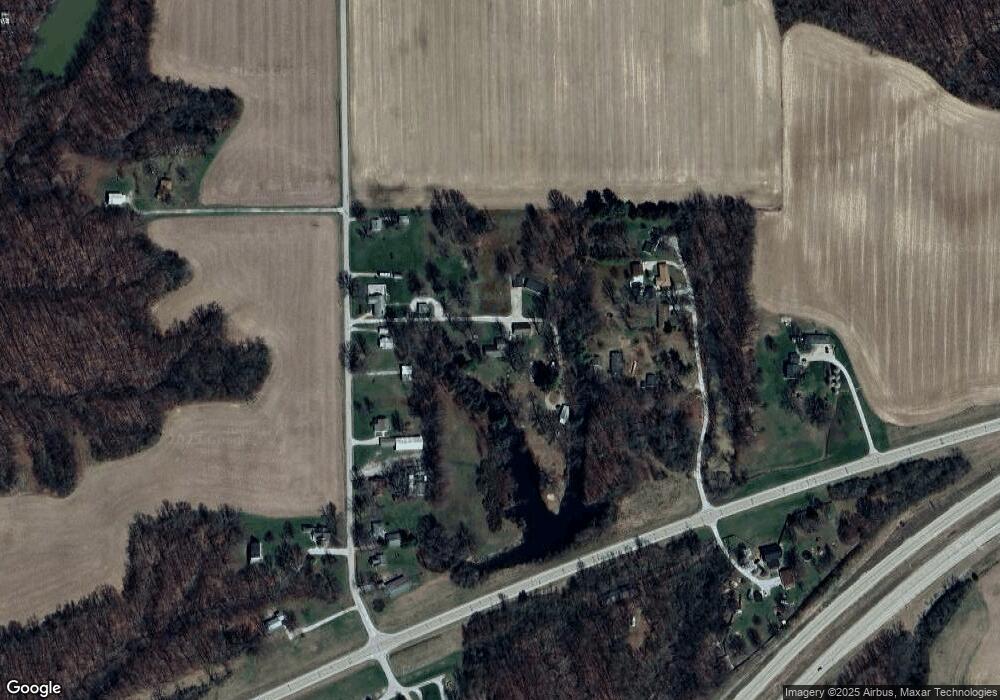
Map
Nearby Homes
- 25583 E Us Hwy 40
- 23840 E 2000th Rd
- 0 S Robinson Place
- 25760 E 1750th Rd
- 0 Crooked Ln Unit Lot WP001 24435818
- 0 N Crews Place
- 0 W Black Dr Unit 108002
- 5140 W Cassaday Dr
- 21702 N Fern Lake Rd
- 0 W Sarah Myers Dr
- 3309 Darwin Rd
- 19996 N 2250th St
- 4849 W Sarah Myers Dr
- 533 N 2225th St
- 3856 W Old Us 40
- 0 N Thorpe Place
- 900 Lower Sandford Rd
- 4298 W Goodson Ave
- 6149 S Kats Place
- 25 S 6th St
- 19666 N Dunlap Rd
- 19658 N Dunlap Rd
- 19672 N Dunlap Rd
- 19592 N Dunlap Rd
- 19445 N Dogwood Hollow Ln
- 19624 N Dunlap Rd
- 19548 N Dunlap Rd
- 19712 N Dunlap Rd
- 19715 N Dogwood Hollow Ln
- 19649 N Dogwood Hollow Ln
- 19526 N Dunlap Rd
- 19512 N Dunlap Rd
- 19534 N Dunlap Rd
- 19498 N Dunlap Rd
- 25577 E Us Highway 40
- 25583 E Us Highway 40
- 25583 E Us Highway 40
- 19519 N Dunlap Rd
- 25536 E Us Highway 40
- 25502 E Us Highway 40