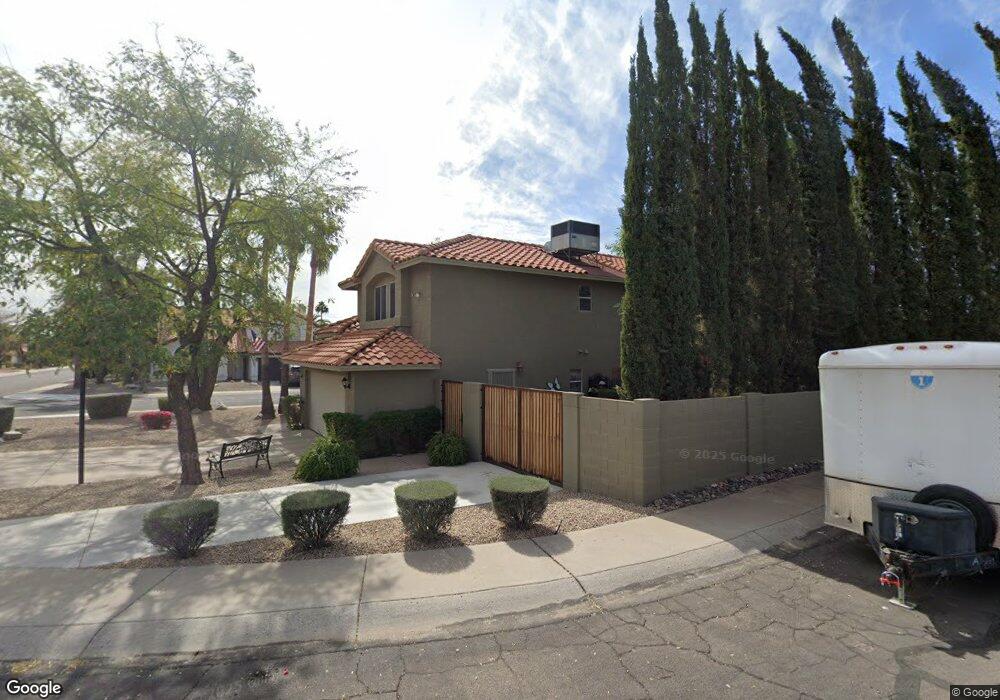
19648 N 35th Place Phoenix, AZ 85050
Paradise Valley Village NeighborhoodEstimated Value: $561,732 - $663,000
--
Bed
3
Baths
2,108
Sq Ft
$289/Sq Ft
Est. Value
About This Home
This home is located at 19648 N 35th Place, Phoenix, AZ 85050 and is currently estimated at $609,183, approximately $288 per square foot. 19648 N 35th Place is a home located in Maricopa County with nearby schools including Quail Run Elementary School, Sunrise Middle School, and Paradise Valley High School.
Ownership History
Date
Name
Owned For
Owner Type
Purchase Details
Closed on
Dec 16, 2024
Sold by
Mongovan Stephanie D and Hargreaves Chris W
Bought by
Hargreaves-Mongovan Trust and Hargreaves
Current Estimated Value
Purchase Details
Closed on
Jul 7, 2003
Sold by
Mongovan Stephanie
Bought by
Mongovan Stephanie D and Hargreaves Chris W
Home Financials for this Owner
Home Financials are based on the most recent Mortgage that was taken out on this home.
Original Mortgage
$139,800
Interest Rate
5.22%
Mortgage Type
Purchase Money Mortgage
Purchase Details
Closed on
Jul 17, 2001
Sold by
Reeves Stephanie D
Bought by
Mongovan Stephanie D
Home Financials for this Owner
Home Financials are based on the most recent Mortgage that was taken out on this home.
Original Mortgage
$138,547
Interest Rate
7.15%
Mortgage Type
FHA
Purchase Details
Closed on
Oct 28, 1998
Sold by
Reeves Kenny R
Bought by
Reeves Stephanie D
Create a Home Valuation Report for This Property
The Home Valuation Report is an in-depth analysis detailing your home's value as well as a comparison with similar homes in the area
Home Values in the Area
Average Home Value in this Area
Purchase History
| Date | Buyer | Sale Price | Title Company |
|---|---|---|---|
| Hargreaves-Mongovan Trust | -- | None Listed On Document | |
| Mongovan Stephanie D | -- | Transnation Title Ins Co | |
| Mongovan Stephanie D | -- | Transnation Title Insurance | |
| Reeves Stephanie D | -- | Capital Title Agency | |
| Reeves Stephanie D | $157,000 | Capital Title Agency |
Source: Public Records
Mortgage History
| Date | Status | Borrower | Loan Amount |
|---|---|---|---|
| Previous Owner | Mongovan Stephanie D | $139,800 | |
| Previous Owner | Mongovan Stephanie D | $138,547 |
Source: Public Records
Tax History
| Year | Tax Paid | Tax Assessment Tax Assessment Total Assessment is a certain percentage of the fair market value that is determined by local assessors to be the total taxable value of land and additions on the property. | Land | Improvement |
|---|---|---|---|---|
| 2025 | $2,514 | $29,029 | -- | -- |
| 2024 | $2,393 | $27,647 | -- | -- |
| 2023 | $2,393 | $44,080 | $8,810 | $35,270 |
| 2022 | $2,371 | $32,610 | $6,520 | $26,090 |
| 2021 | $2,410 | $30,660 | $6,130 | $24,530 |
| 2020 | $2,328 | $29,160 | $5,830 | $23,330 |
| 2019 | $2,338 | $27,980 | $5,590 | $22,390 |
| 2018 | $2,253 | $25,470 | $5,090 | $20,380 |
| 2017 | $2,152 | $24,370 | $4,870 | $19,500 |
| 2016 | $2,118 | $24,260 | $4,850 | $19,410 |
| 2015 | $1,965 | $21,700 | $4,340 | $17,360 |
Source: Public Records
Map
Nearby Homes
- 3525 E Wickieup Ln
- 3407 E Escuda Rd
- 3569 E Utopia Rd
- 3401 E Menadota Dr
- 3542 E Kerry Ln
- 3611 E Kristal Way
- 20007 N 33rd St
- 3426 E Clark Rd
- 3206 E Kristal Way
- 19802 N 32nd St Unit 169
- 19802 N 32nd St Unit 65
- 19802 N 32nd St Unit 73
- 19802 N 32nd St Unit OFC
- 3314 E Longhorn Dr
- 3154 E Wahalla Ln
- 3117 E Kristal Way
- 3326 E Hononegh Dr
- 19602 N 32nd St Unit 129
- 19602 N 32nd St Unit 125
- 19602 N 32nd St Unit 32
- 3514 E Tonto Ln
- 19654 N 35th Place
- 3519 E Tonto Ln
- 3525 E Tonto Ln
- 3508 E Tonto Ln
- 3538 E Tonto Ln
- 3513 E Tonto Ln
- 19659 N 35th Place
- 19651 N 35th Place
- 19655 N 35th Place
- 19651 N 35th St
- 3507 E Tonto Ln
- 3537 E Tonto Ln
- 3520 E Oraibi Dr
- 3526 E Oraibi Dr
- 3501 E Tonto Ln
- 3514 E Oraibi Dr
- 3543 E Tonto Ln
- 19650 N 36th St
- 19655 N 35th St
Your Personal Tour Guide
Ask me questions while you tour the home.