Estimated Value: $605,000 - $713,000
4
Beds
2
Baths
2,147
Sq Ft
$312/Sq Ft
Est. Value
About This Home
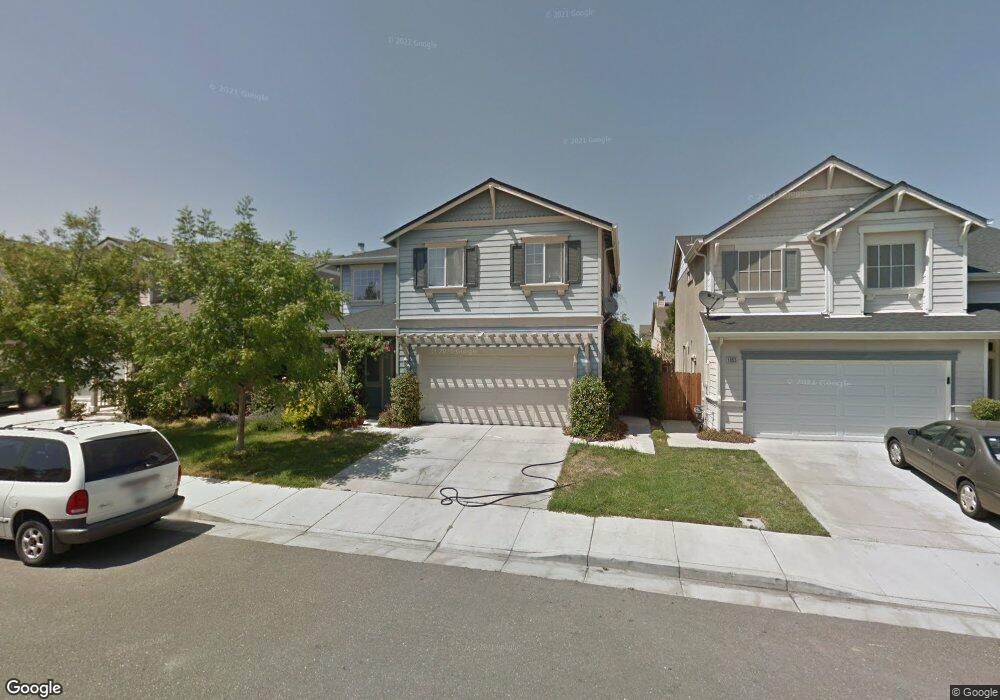
This home is located at 1965 Calaveras Ct, Tracy, CA 95377 and is currently estimated at $670,568, approximately $312 per square foot. 1965 Calaveras Ct is a home located in San Joaquin County with nearby schools including Anthony C. Traina Elementary School, John C. Kimball High School, and Montessori Elementary & Middle School of Tracy.
Ownership History
Date
Name
Owned For
Owner Type
Purchase Details
Closed on
May 22, 2013
Sold by
Tong Dave and Zheng Rebecca Bin
Bought by
Tong Dave and Zheng Rebecca Bin
Current Estimated Value
Home Financials for this Owner
Home Financials are based on the most recent Mortgage that was taken out on this home.
Original Mortgage
$225,000
Outstanding Balance
$158,934
Interest Rate
3.41%
Mortgage Type
New Conventional
Estimated Equity
$511,634
Purchase Details
Closed on
Aug 12, 2009
Sold by
Deutsche Bank National Trust
Bought by
Tong Dave Deyu and Zheng Rebecca Bin
Purchase Details
Closed on
Jun 11, 2009
Sold by
Hallock Kim M and Hallock Paul A
Bought by
Deutsche Bank National Trust Company
Purchase Details
Closed on
Jul 11, 2003
Sold by
Western Pacific Housing Inc
Bought by
Hallock Paul A and Hallock Kim M
Home Financials for this Owner
Home Financials are based on the most recent Mortgage that was taken out on this home.
Original Mortgage
$273,750
Interest Rate
5.18%
Mortgage Type
Purchase Money Mortgage
Create a Home Valuation Report for This Property
The Home Valuation Report is an in-depth analysis detailing your home's value as well as a comparison with similar homes in the area
Home Values in the Area
Average Home Value in this Area
Purchase History
| Date | Buyer | Sale Price | Title Company |
|---|---|---|---|
| Tong Dave | -- | Old Republic Title Company | |
| Tong Dave Deyu | $228,000 | First American Title Company | |
| Deutsche Bank National Trust Company | $191,250 | None Available | |
| Hallock Paul A | $342,500 | First Amer Title Co |
Source: Public Records
Mortgage History
| Date | Status | Borrower | Loan Amount |
|---|---|---|---|
| Open | Tong Dave | $225,000 | |
| Previous Owner | Hallock Paul A | $273,750 | |
| Closed | Hallock Paul A | $51,300 |
Source: Public Records
Tax History Compared to Growth
Tax History
| Year | Tax Paid | Tax Assessment Tax Assessment Total Assessment is a certain percentage of the fair market value that is determined by local assessors to be the total taxable value of land and additions on the property. | Land | Improvement |
|---|---|---|---|---|
| 2025 | $4,434 | $294,288 | $73,570 | $220,718 |
| 2024 | $4,302 | $288,519 | $72,128 | $216,391 |
| 2023 | $4,219 | $282,863 | $70,714 | $212,149 |
| 2022 | $4,392 | $277,318 | $69,328 | $207,990 |
| 2021 | $4,308 | $271,881 | $67,969 | $203,912 |
| 2020 | $4,260 | $269,095 | $67,273 | $201,822 |
| 2019 | $4,183 | $263,819 | $65,954 | $197,865 |
| 2018 | $4,101 | $258,647 | $64,661 | $193,986 |
| 2017 | $4,009 | $253,577 | $63,394 | $190,183 |
| 2016 | $3,940 | $248,607 | $62,152 | $186,455 |
| 2014 | $3,841 | $240,080 | $60,020 | $180,060 |
Source: Public Records
Map
Nearby Homes
- 1994 Remembrance Ln
- 1955 Calaveras Ct
- 4135 Keepsake Ct
- 4312 Middlefield Dr
- 4683 Avalon St
- 2351 Ellis Town Dr
- 4150 Cherry Blossom Ln
- 2305 Augusta Ave
- 2342 Augusta Ave
- 2381 Ellis Town Dr
- 3339 Boca Way
- 2393 Augusta Ave
- Marabou Plan at Regency at Tracy Lakes - Pinecrest Collection
- Rubicon Plan at Regency at Tracy Lakes - Calero Collection
- Quigley Plan at Regency at Tracy Lakes - Pinecrest Collection
- Verdi Plan at Regency at Tracy Lakes - Laguna Collection
- Triton Plan at Regency at Tracy Lakes - Pinecrest Collection
- Miramar Plan at Regency at Tracy Lakes - Echo Collection
- Angora Plan at Regency at Tracy Lakes - Calero Collection
- Martis Plan at Regency at Tracy Lakes - Laguna Collection
- 1975 Calaveras Ct
- 1985 Calaveras Ct
- 1945 Calaveras Ct
- 1964 Remembrance Ln
- 1974 Remembrance Ln
- 1954 Remembrance Ln
- 1984 Remembrance Ln
- 1944 Remembrance Ln
- 1935 Calaveras Ct
- 1995 Calaveras Ct
- 1956 Calaveras Ct
- 1966 Calaveras Ct
- 1946 Calaveras Ct
- 1934 Remembrance Ln
- 1976 Calaveras Ct
- 1925 Calaveras Ct
- 1936 Calaveras Ct
- 1924 Remembrance Ln
- 2005 Calaveras Ct
- 1926 Calaveras Ct