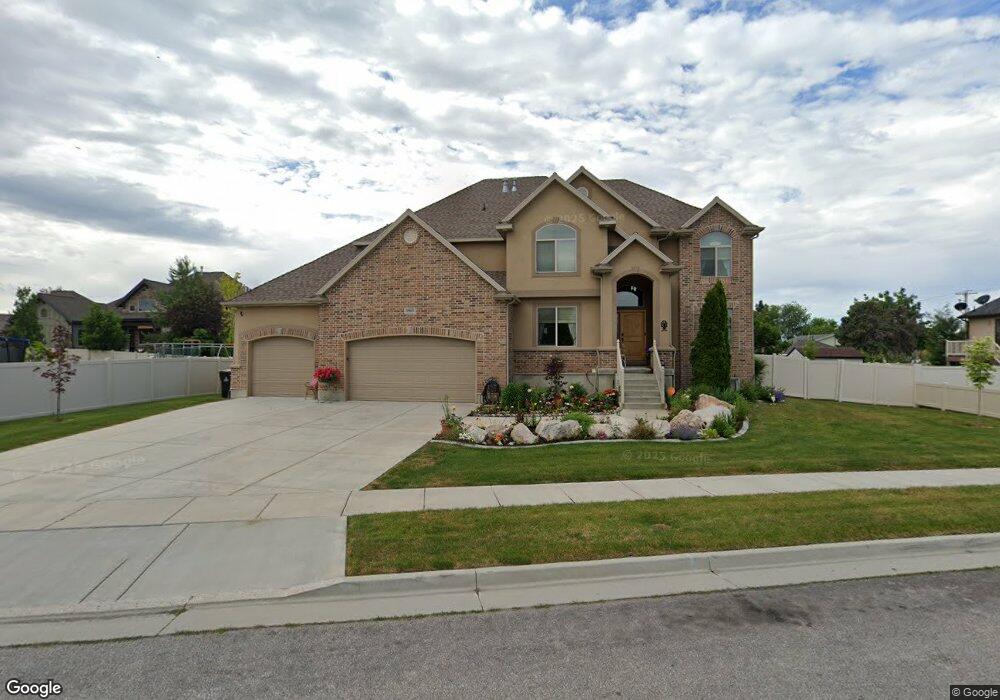
1965 W 2575 S Syracuse, UT 84075
Estimated Value: $674,000 - $768,000
--
Bed
4
Baths
2,662
Sq Ft
$274/Sq Ft
Est. Value
About This Home
This home is located at 1965 W 2575 S, Syracuse, UT 84075 and is currently estimated at $730,513, approximately $274 per square foot. 1965 W 2575 S is a home located in Davis County with nearby schools including Syracuse Elementary School, Syracuse Junior High School, and Syracuse High School.
Ownership History
Date
Name
Owned For
Owner Type
Purchase Details
Closed on
Feb 8, 2008
Sold by
Bank Of New York
Bought by
Holt Kathleen H
Current Estimated Value
Purchase Details
Closed on
Oct 5, 2007
Sold by
Faulkner Susan
Bought by
Bank Of New York
Purchase Details
Closed on
Oct 26, 2005
Sold by
Armey Joshua P and Armey Jaime J
Bought by
Faulkner Susan
Home Financials for this Owner
Home Financials are based on the most recent Mortgage that was taken out on this home.
Original Mortgage
$80,000
Interest Rate
5.25%
Mortgage Type
Stand Alone Second
Purchase Details
Closed on
Oct 2, 2004
Sold by
Rainey Homes Inc
Bought by
Armey Joshua P and Armey Jaime J
Home Financials for this Owner
Home Financials are based on the most recent Mortgage that was taken out on this home.
Original Mortgage
$256,555
Interest Rate
4.87%
Mortgage Type
Purchase Money Mortgage
Create a Home Valuation Report for This Property
The Home Valuation Report is an in-depth analysis detailing your home's value as well as a comparison with similar homes in the area
Home Values in the Area
Average Home Value in this Area
Purchase History
| Date | Buyer | Sale Price | Title Company |
|---|---|---|---|
| Holt Kathleen H | -- | First American Title | |
| Bank Of New York | $328,050 | Inwest Title Services Inc | |
| Faulkner Susan | -- | First American Title | |
| Armey Joshua P | -- | Heritage West Title Ins |
Source: Public Records
Mortgage History
| Date | Status | Borrower | Loan Amount |
|---|---|---|---|
| Previous Owner | Faulkner Susan | $80,000 | |
| Previous Owner | Faulkner Susan | $320,000 | |
| Previous Owner | Armey Joshua P | $256,555 | |
| Closed | Armey Joshua P | $64,139 |
Source: Public Records
Tax History
| Year | Tax Paid | Tax Assessment Tax Assessment Total Assessment is a certain percentage of the fair market value that is determined by local assessors to be the total taxable value of land and additions on the property. | Land | Improvement |
|---|---|---|---|---|
| 2025 | $4,127 | $398,200 | $123,707 | $274,493 |
| 2024 | $3,867 | $375,650 | $101,129 | $274,521 |
| 2023 | $3,820 | $676,000 | $140,978 | $535,022 |
| 2022 | $4,047 | $392,700 | $81,315 | $311,385 |
| 2021 | $3,515 | $528,000 | $120,031 | $407,969 |
| 2020 | $3,143 | $457,000 | $105,154 | $351,846 |
| 2019 | $2,974 | $427,000 | $102,057 | $324,943 |
| 2018 | $2,786 | $397,000 | $98,955 | $298,045 |
| 2016 | $2,528 | $188,925 | $38,008 | $150,917 |
| 2015 | $2,577 | $183,425 | $38,008 | $145,417 |
| 2014 | $2,387 | $173,104 | $38,008 | $135,096 |
| 2013 | -- | $156,957 | $33,605 | $123,352 |
Source: Public Records
Map
Nearby Homes
- 1876 W 2400 S
- 1826 W 2350 S
- 1686 W 2425 S
- 1651 W 2700 S Unit 217
- 1667 W 2770 S Unit 206
- 1643 W 2700 S Unit 216
- 2732 S Allison Way Unit 214
- 2742 S Allison Way Unit 212
- 2894 Trailside Dr
- 2104 W 2200 S
- 2721 S Allison Way
- 2136 W 2200 S
- 2734 S Allison Way Unit 213
- 2653 S 2430 W Unit 115
- 2968 Old Emigrant Rd
- 1694 2975 S Unit D
- 2574 S 2430 W Unit 503
- 2594 S 2430 W Unit 501
- 2666 S 2430 W Unit 103
- 1664 2975 S Unit B
- 1965 Camino Blvd
- 1965 W Camino Blvd
- 1983 W 2575 S
- 1962 W 2615 South Cir
- 2586 S 1950 W
- 2581 S 2000 W
- 1958 W 2615 South Cir
- 2543 S 2000 W
- 2597 S 2000 W
- 2548 S 1950 W
- 1964 W 2615 South Cir
- 2208 W 2615 S Unit 141
- 1455 W 2615 S Unit 14
- 1458 W 2615 S Unit 7
- 2517 S 2000 W
- 2572 S 2000 W
- 2599 S 2000 W
- 2532 S 1950 W
- 2554 S 2000 W
- 1961 W 2615 South Cir
Your Personal Tour Guide
Ask me questions while you tour the home.