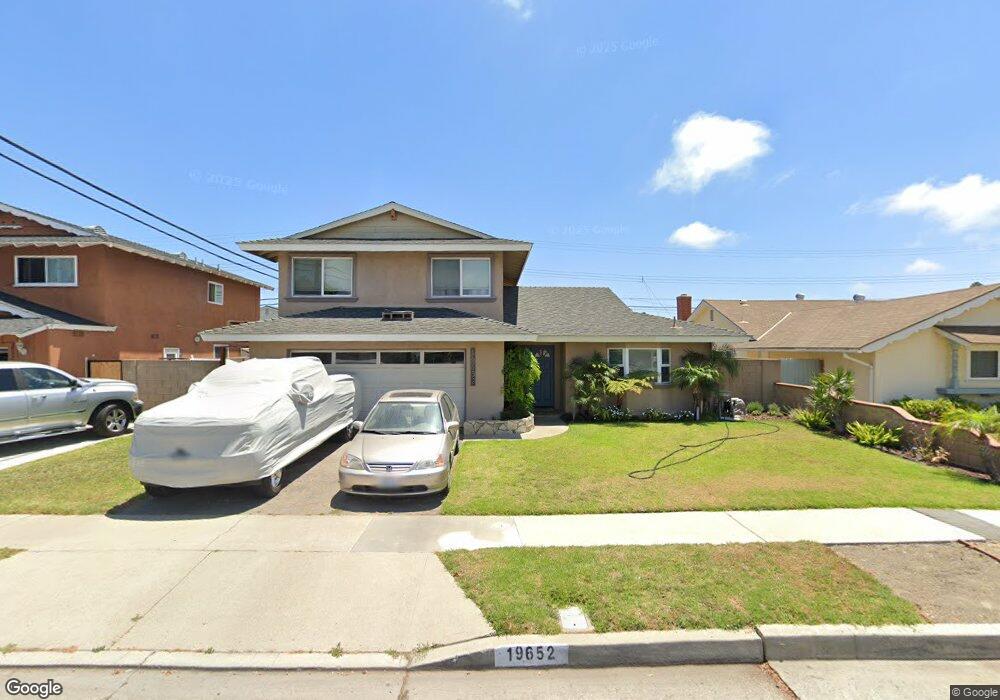
19652 Canberra Ln Huntington Beach, CA 92646
Estimated Value: $1,366,000 - $1,499,000
5
Beds
2
Baths
1,982
Sq Ft
$725/Sq Ft
Est. Value
About This Home
This home is located at 19652 Canberra Ln, Huntington Beach, CA 92646 and is currently estimated at $1,437,215, approximately $725 per square foot. 19652 Canberra Ln is a home located in Orange County with nearby schools including Isojiro Oka Elementary, Talbert Middle School, and Edison High School.
Ownership History
Date
Name
Owned For
Owner Type
Purchase Details
Closed on
Jun 25, 2008
Sold by
Hearn Ronald W
Bought by
Hearn Ronald W
Current Estimated Value
Home Financials for this Owner
Home Financials are based on the most recent Mortgage that was taken out on this home.
Original Mortgage
$360,000
Outstanding Balance
$232,247
Interest Rate
6.07%
Mortgage Type
New Conventional
Estimated Equity
$1,204,968
Purchase Details
Closed on
Mar 25, 1998
Sold by
Hearn Yamile D
Bought by
Hearn Ronald W
Home Financials for this Owner
Home Financials are based on the most recent Mortgage that was taken out on this home.
Original Mortgage
$227,000
Interest Rate
7.06%
Purchase Details
Closed on
Mar 2, 1998
Sold by
Joseph Collura and Joseph Josephine
Bought by
Hearn Ronald W
Home Financials for this Owner
Home Financials are based on the most recent Mortgage that was taken out on this home.
Original Mortgage
$227,000
Interest Rate
7.06%
Create a Home Valuation Report for This Property
The Home Valuation Report is an in-depth analysis detailing your home's value as well as a comparison with similar homes in the area
Home Values in the Area
Average Home Value in this Area
Purchase History
| Date | Buyer | Sale Price | Title Company |
|---|---|---|---|
| Hearn Ronald W | -- | Ticor Title Company | |
| Hearn Ronald W | -- | Orange Coast Title | |
| Hearn Ronald W | $245,000 | Orange Coast Title |
Source: Public Records
Mortgage History
| Date | Status | Borrower | Loan Amount |
|---|---|---|---|
| Open | Hearn Ronald W | $360,000 | |
| Closed | Hearn Ronald W | $227,000 |
Source: Public Records
Tax History Compared to Growth
Tax History
| Year | Tax Paid | Tax Assessment Tax Assessment Total Assessment is a certain percentage of the fair market value that is determined by local assessors to be the total taxable value of land and additions on the property. | Land | Improvement |
|---|---|---|---|---|
| 2025 | $4,506 | $391,195 | $247,804 | $143,391 |
| 2024 | $4,506 | $383,525 | $242,945 | $140,580 |
| 2023 | $4,398 | $376,005 | $238,181 | $137,824 |
| 2022 | $4,330 | $368,633 | $233,511 | $135,122 |
| 2021 | $4,246 | $361,405 | $228,932 | $132,473 |
| 2020 | $4,220 | $357,700 | $226,585 | $131,115 |
| 2019 | $4,135 | $350,687 | $222,142 | $128,545 |
| 2018 | $4,056 | $343,811 | $217,786 | $126,025 |
| 2017 | $3,991 | $337,070 | $213,516 | $123,554 |
| 2016 | $3,823 | $330,461 | $209,329 | $121,132 |
| 2015 | $3,764 | $325,498 | $206,185 | $119,313 |
| 2014 | $3,689 | $319,122 | $202,146 | $116,976 |
Source: Public Records
Map
Nearby Homes
- 10022 Bismark Dr
- 19880 Berkshire Ln
- 19922 Carmania Ln
- 19941 Carmania Ln
- 19774 Cambridge Ln
- 9831 Continental Dr
- 19860 Claremont Ln
- 19361 Brookhurst St Unit 87
- 19361 Brookhurst St Unit 50
- 19361 Brookhurst St Unit 184
- 19361 Brookhurst St Unit 22
- 19361 Brookhurst St Unit 159
- 19361 Brookhurst St Unit 21
- 19361 Brookhurst St Unit 33
- 19361 Brookhurst St Unit 143
- 19350 Ward St Unit 57
- 19350 Ward St Unit 38
- 19350 Ward St Unit 14
- 19843 Coventry Ln
- 2021 Kornat Dr
- 19632 Canberra Ln
- 19662 Canberra Ln
- 19641 Constellation Ln
- 19631 Constellation Ln
- 19661 Constellation Ln
- 19672 Canberra Ln
- 19622 Canberra Ln
- 10211 Constitution Dr
- 19621 Constellation Ln
- 19671 Constellation Ln
- 10212 Merrimac Dr
- 19612 Canberra Ln
- 19682 Canberra Ln
- 19611 Constellation Ln
- 19681 Constellation Ln
- 10201 Constitution Dr
- 10202 Merrimac Dr
- 10212 Constitution Dr
- 19602 Canberra Ln
- 19692 Canberra Ln