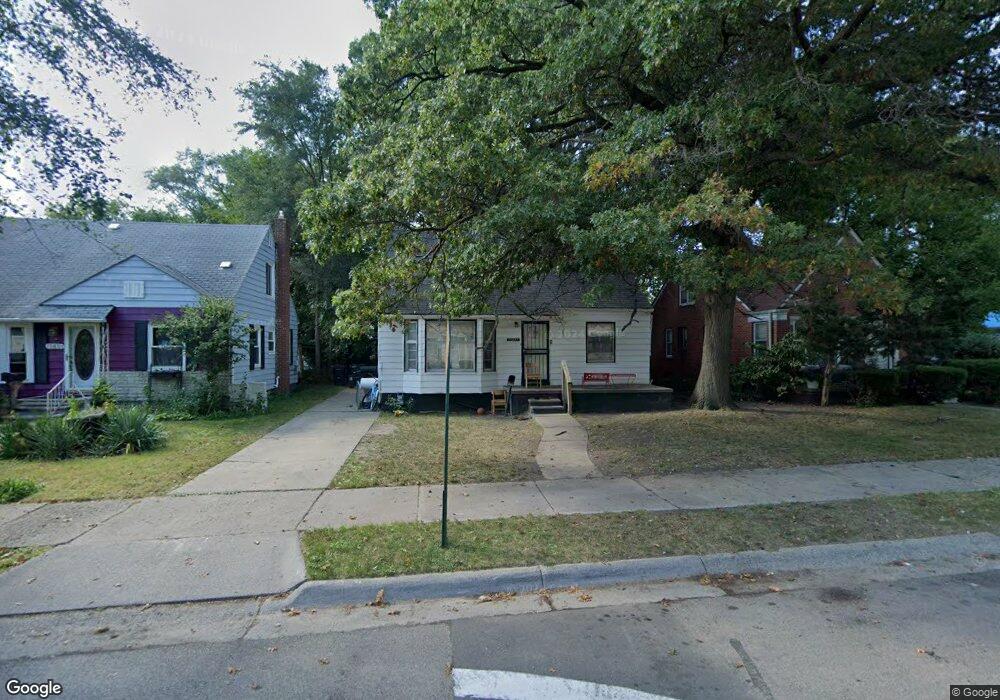
19661 Fenelon St Detroit, MI 48234
Farwell NeighborhoodEstimated Value: $65,000 - $87,000
--
Bed
1
Bath
999
Sq Ft
$77/Sq Ft
Est. Value
About This Home
This home is located at 19661 Fenelon St, Detroit, MI 48234 and is currently estimated at $77,300, approximately $77 per square foot. 19661 Fenelon St is a home located in Wayne County with nearby schools including Mason Academy, Edward 'Duke' Ellington Conservatory of Music and Art, and Charles L. Spain Elementary-Middle School.
Ownership History
Date
Name
Owned For
Owner Type
Purchase Details
Closed on
Sep 5, 2023
Sold by
Rhms Group Inc
Bought by
Dexter Group Trust and Wilmington Savings Fund Society Fsb
Current Estimated Value
Purchase Details
Closed on
Oct 16, 2017
Sold by
Sabree Eric R
Bought by
Rhms Group Inc
Purchase Details
Closed on
Sep 25, 2014
Sold by
Michigan Recon Inc
Bought by
Fenelon 19661 Llc
Purchase Details
Closed on
Nov 7, 2013
Sold by
Wayne County Treasurer
Bought by
Michigan Recon Inc
Purchase Details
Closed on
Aug 4, 2005
Sold by
Hardaway Vandus E and Hardaway Linda
Bought by
Smith Michael
Purchase Details
Closed on
Sep 30, 2004
Sold by
Hardaway Linda and Hardaway Vandus E
Bought by
Manufacturers & Traders Trust Co and Securitization Series 1999-2
Create a Home Valuation Report for This Property
The Home Valuation Report is an in-depth analysis detailing your home's value as well as a comparison with similar homes in the area
Home Values in the Area
Average Home Value in this Area
Purchase History
| Date | Buyer | Sale Price | Title Company |
|---|---|---|---|
| Dexter Group Trust | $130,542 | None Listed On Document | |
| Rhms Group Inc | $7,200 | None Available | |
| Fenelon 19661 Llc | $37,000 | None Available | |
| Michigan Recon Inc | $1,600 | None Available | |
| Smith Michael | $75,000 | Fatic | |
| Manufacturers & Traders Trust Co | $28,142 | -- |
Source: Public Records
Tax History Compared to Growth
Tax History
| Year | Tax Paid | Tax Assessment Tax Assessment Total Assessment is a certain percentage of the fair market value that is determined by local assessors to be the total taxable value of land and additions on the property. | Land | Improvement |
|---|---|---|---|---|
| 2025 | $1,199 | $15,000 | $0 | $0 |
| 2024 | $1,199 | $12,600 | $0 | $0 |
| 2023 | $817 | $9,975 | $0 | $0 |
| 2022 | $886 | $9,200 | $0 | $0 |
| 2021 | $939 | $5,780 | $0 | $0 |
| 2020 | $702 | $6,100 | $0 | $0 |
| 2019 | $694 | $5,130 | $0 | $0 |
| 2018 | $633 | $5,300 | $0 | $0 |
| 2017 | $95 | $5,000 | $0 | $0 |
| 2016 | $1,121 | $18,800 | $0 | $0 |
| 2015 | $1,160 | $11,600 | $0 | $0 |
| 2013 | $1,453 | $14,533 | $0 | $0 |
| 2010 | -- | $21,308 | $1,145 | $20,163 |
Source: Public Records
Map
Nearby Homes
- 19451 Conley St
- 19437 Conley St
- 3040 E Outer Dr
- 19696 Healy St
- 19373 Fenelon St
- 19366 Fenelon St
- 19403 Moenart St
- 19345 Keystone St
- 19931 Keystone St
- 19347 Moenart St
- 19230 Conley St
- 19235 Lamont St
- 19410 Justine St
- 19948 Moenart St
- 19392 Justine St
- 3191 E Outer Dr
- 19608 Buffalo St
- 19301 Eureka St
- 20057 Keystone St
- 19207 Moenart St
- 19651 Fenelon St
- 19671 Fenelon St
- 19643 Fenelon St
- 19685 Fenelon St
- 19656 Lamont St
- 19635 Fenelon St
- 19646 Lamont St
- 19640 Lamont St
- 19676 Lamont St
- 19656 Fenelon St
- 19646 Fenelon St
- 19670 Fenelon St
- 19627 Fenelon St
- 19699 Fenelon St
- 19686 Lamont St
- 19630 Lamont St
- 19638 Fenelon St
- 19680 Fenelon St
- 19626 Fenelon St
- 19665 Conley St