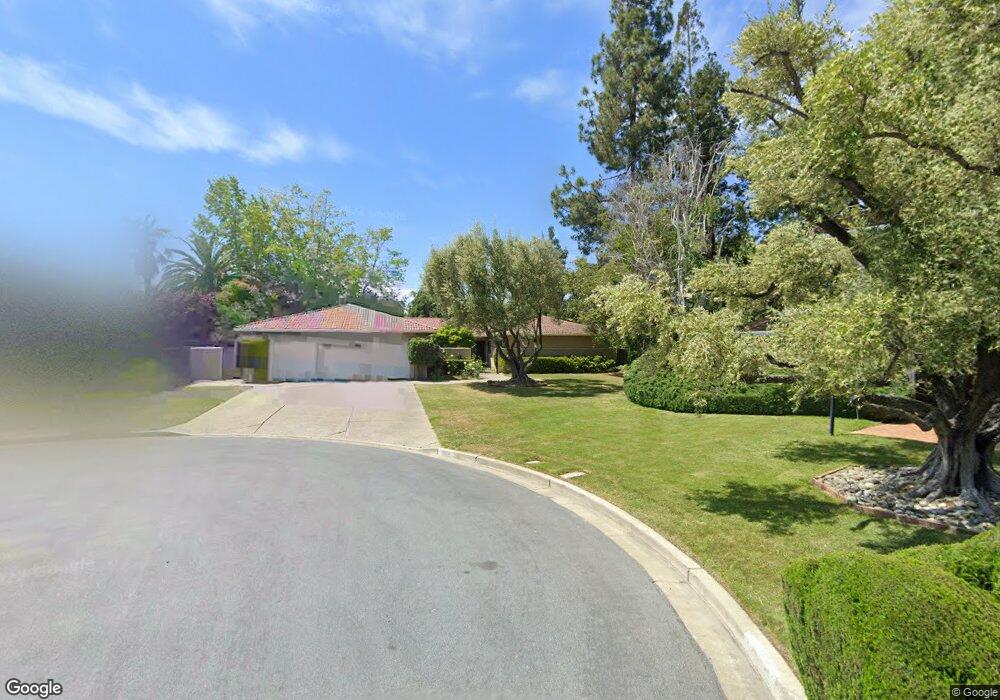
19661 Ladera Ct Saratoga, CA 95070
West San Jose NeighborhoodEstimated Value: $3,986,000 - $4,500,000
4
Beds
3
Baths
2,768
Sq Ft
$1,545/Sq Ft
Est. Value
About This Home
This home is located at 19661 Ladera Ct, Saratoga, CA 95070 and is currently estimated at $4,276,622, approximately $1,545 per square foot. 19661 Ladera Ct is a home located in Santa Clara County with nearby schools including Blue Hills Elementary School, Joaquin Miller Middle, and Lynbrook High School.
Ownership History
Date
Name
Owned For
Owner Type
Purchase Details
Closed on
Mar 13, 2021
Sold by
The Stella & Tien Ping Ying Real Estate
Bought by
Ying Tien Ping and Ying Stella H
Current Estimated Value
Home Financials for this Owner
Home Financials are based on the most recent Mortgage that was taken out on this home.
Original Mortgage
$300,000
Outstanding Balance
$269,831
Interest Rate
2.9%
Mortgage Type
New Conventional
Estimated Equity
$4,006,791
Purchase Details
Closed on
Jul 23, 2009
Sold by
Ying Tien Ping and Ying Stella H
Bought by
The Stella & Tien Ping Ying Real Estate
Purchase Details
Closed on
Jan 4, 2005
Sold by
Ying Tien Ping and Ying Stella H
Bought by
The Stella & Tien Ping Ying Real Estate
Purchase Details
Closed on
May 8, 2001
Sold by
Ying Tien Ping
Bought by
Ying Tien Ping and Ying Stella H
Home Financials for this Owner
Home Financials are based on the most recent Mortgage that was taken out on this home.
Original Mortgage
$410,000
Interest Rate
6.89%
Purchase Details
Closed on
Jan 30, 1996
Sold by
Ying Stella H
Bought by
Ying Tien Ping
Home Financials for this Owner
Home Financials are based on the most recent Mortgage that was taken out on this home.
Original Mortgage
$207,000
Interest Rate
7.25%
Create a Home Valuation Report for This Property
The Home Valuation Report is an in-depth analysis detailing your home's value as well as a comparison with similar homes in the area
Home Values in the Area
Average Home Value in this Area
Purchase History
| Date | Buyer | Sale Price | Title Company |
|---|---|---|---|
| Ying Tien Ping | -- | Amrock Llc | |
| The Stella & Tien Ping Ying Real Estate | -- | Chicago Title Company | |
| Ying Tien Ping | -- | Chicago Title Company | |
| The Stella & Tien Ping Ying Real Estate | -- | -- | |
| Ying Tien Ping | -- | Landsafe Title | |
| Ying Tien Ping | -- | Fidelity National Title Ins |
Source: Public Records
Mortgage History
| Date | Status | Borrower | Loan Amount |
|---|---|---|---|
| Open | Ying Tien Ping | $300,000 | |
| Previous Owner | Ying Tien Ping | $410,000 | |
| Previous Owner | Ying Tien Ping | $207,000 |
Source: Public Records
Tax History Compared to Growth
Tax History
| Year | Tax Paid | Tax Assessment Tax Assessment Total Assessment is a certain percentage of the fair market value that is determined by local assessors to be the total taxable value of land and additions on the property. | Land | Improvement |
|---|---|---|---|---|
| 2025 | $15,005 | $1,232,653 | $712,470 | $520,183 |
| 2024 | $15,005 | $1,208,484 | $698,500 | $509,984 |
| 2023 | $14,873 | $1,184,789 | $684,804 | $499,985 |
| 2022 | $14,830 | $1,161,559 | $671,377 | $490,182 |
| 2021 | $14,658 | $1,138,784 | $658,213 | $480,571 |
| 2020 | $14,463 | $1,127,108 | $651,464 | $475,644 |
| 2019 | $14,116 | $1,105,009 | $638,691 | $466,318 |
| 2018 | $13,771 | $1,083,343 | $626,168 | $457,175 |
| 2017 | $13,688 | $1,062,102 | $613,891 | $448,211 |
| 2016 | $13,235 | $1,041,277 | $601,854 | $439,423 |
| 2015 | $13,114 | $1,025,637 | $592,814 | $432,823 |
| 2014 | $12,766 | $1,005,547 | $581,202 | $424,345 |
Source: Public Records
Map
Nearby Homes
- 1681 Danromas Way
- 19920 Viewridge Dr
- 1587 Miller Ave
- 12140 Woodside Dr
- 12790 Glen Arbor Ct
- 13010 Glen Brae Dr
- 19437 Via Real Dr
- 6757 Devonshire Dr
- 6886 Chantel Ct
- 6923 Chantel Ct Unit 92
- 19662 Via Grande Dr
- 5635 W Walbrook Dr
- 18396 Mill Ct
- 19423 Vineyard Ln
- 19113 Vineyard Ln
- 20717 Meadow Oak Rd
- 20077 Ljepava Dr
- 1577 Maurice Ln
- 7344 Rainbow Dr
- 20811 Norada Ct
- 19656 Ladera Ct
- 19668 Ashton Ct
- 19645 Ladera Ct
- 12176 Terrence Ave
- 19644 Ashton Ct
- 12188 Terrence Ave
- 12168 Terrence Ave
- 19648 Ladera Ct
- 12222 Terrence Ave
- 19684 Ashton Ct
- 19618 Ashton Ct
- 19619 Ladera Ct
- 12154 Terrence Ave
- 19663 Somerville Dr
- 19630 Ladera Ct
- 19685 Somerville Dr
- 19671 Ashton Ct
- 19655 Ashton Ct
- 19647 Somerville Dr
- 12146 Terrence Ave