Estimated Value: $446,738 - $488,000
3
Beds
3
Baths
3,636
Sq Ft
$130/Sq Ft
Est. Value
About This Home
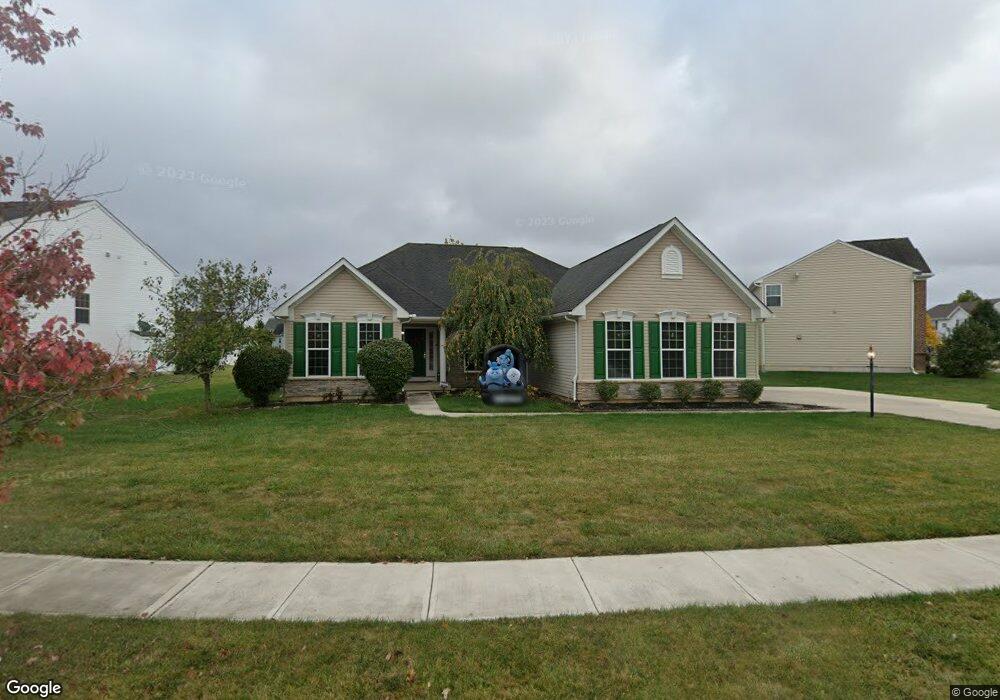
This home is located at 1967 Daffodil Dr, Xenia, OH 45385 and is currently estimated at $473,685, approximately $130 per square foot. 1967 Daffodil Dr is a home located in Greene County with nearby schools including Trebein Elementary School, Jacob Coy Middle School, and Beavercreek High School.
Ownership History
Date
Name
Owned For
Owner Type
Purchase Details
Closed on
Jan 28, 2019
Sold by
Wethington Randy T and Wethington Maria K
Bought by
Brown Richard H and Brown Doris Traudl
Current Estimated Value
Home Financials for this Owner
Home Financials are based on the most recent Mortgage that was taken out on this home.
Original Mortgage
$459,000
Outstanding Balance
$403,543
Interest Rate
4.5%
Mortgage Type
Adjustable Rate Mortgage/ARM
Estimated Equity
$70,142
Purchase Details
Closed on
Jun 28, 2011
Sold by
Nvr Inc
Bought by
Wethington Randy T and Wethington Marla K
Home Financials for this Owner
Home Financials are based on the most recent Mortgage that was taken out on this home.
Original Mortgage
$314,249
Interest Rate
4.52%
Mortgage Type
VA
Purchase Details
Closed on
Mar 30, 2011
Sold by
Oberer Land Developers Ltd
Bought by
Nvr Inc
Create a Home Valuation Report for This Property
The Home Valuation Report is an in-depth analysis detailing your home's value as well as a comparison with similar homes in the area
Home Values in the Area
Average Home Value in this Area
Purchase History
| Date | Buyer | Sale Price | Title Company |
|---|---|---|---|
| Brown Richard H | $339,000 | None Available | |
| Wethington Randy T | $344,900 | None Available | |
| Nvr Inc | $60,700 | None Available |
Source: Public Records
Mortgage History
| Date | Status | Borrower | Loan Amount |
|---|---|---|---|
| Open | Brown Richard H | $459,000 | |
| Previous Owner | Wethington Randy T | $314,249 |
Source: Public Records
Tax History Compared to Growth
Tax History
| Year | Tax Paid | Tax Assessment Tax Assessment Total Assessment is a certain percentage of the fair market value that is determined by local assessors to be the total taxable value of land and additions on the property. | Land | Improvement |
|---|---|---|---|---|
| 2024 | $7,378 | $127,330 | $27,020 | $100,310 |
| 2023 | $7,378 | $127,330 | $27,020 | $100,310 |
| 2022 | $7,062 | $106,410 | $22,510 | $83,900 |
| 2021 | $7,139 | $106,410 | $22,510 | $83,900 |
| 2020 | $7,181 | $106,410 | $22,510 | $83,900 |
| 2019 | $7,864 | $105,030 | $24,940 | $80,090 |
| 2018 | $6,917 | $105,030 | $24,940 | $80,090 |
| 2017 | $6,684 | $105,030 | $24,940 | $80,090 |
| 2016 | $6,595 | $100,690 | $21,830 | $78,860 |
| 2015 | $6,644 | $100,690 | $21,830 | $78,860 |
| 2014 | $6,504 | $100,690 | $21,830 | $78,860 |
Source: Public Records
Map
Nearby Homes
- 1922 Spring Ridge Dr
- 1788 Fawnwood Ct
- 1105 Windsong Trail
- 1878 Spring Meadows Dr
- 1281 Whitetail Dr
- 508 Glenhaven Way Unit 756-300
- 506 Glenhaven Way Unit 756-204
- 516 Glenhaven Way Unit 756-304
- 502 Glenhaven Way Unit 756-202
- 500 Glenhaven Way Unit 756-201
- 510 Glenhaven Way Unit 756-301
- 456 Glenhaven Way Unit 754-304
- 474 Glenhaven Way Unit 755-303
- 518 Glenhaven Way Unit 756-305
- 470 Glenhaven Way Unit 755-301
- 464 Glenhaven Way Unit 755-203
- 462 Glenhaven Way Unit 755-202
- 2657 Verdant Ln Unit 759-304
- 2655 Verdant Ln Unit 759-303
- 2659 Verdant Ln Unit 759-305
- 1955 Daffodil Dr
- 1977 Daffodil Dr
- 1947 Daffodil Dr
- 1964 Daffodil Dr
- 1970 Daffodil Dr
- 1941 Daffodil Dr
- 1941 Daffodil Dr
- 1941 Daffodil Dr
- 1958 Spring Ridge Dr
- 1978 Spring Ridge Dr
- 1948 Daffodil Dr
- 1950 Spring Ridge Dr
- 1984 Daffodil Dr
- 1988 Daffodil Dr
- 1942 Daffodil Dr
- 1968 Spring Ridge Dr
- 1944 Spring Ridge Dr
- 1942 Daffodil Dr
- 1933 Daffodil Dr
- 1987 Spring Ridge Dr