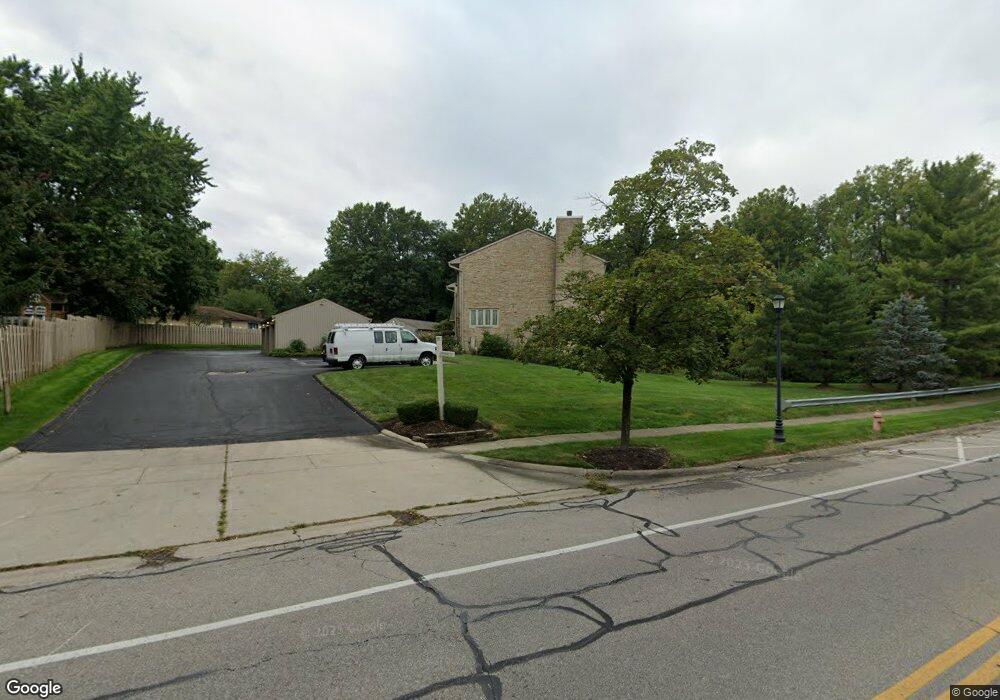
1968 Cheshire Commons Ct Unit 2 Columbus, OH 43229
Northgate NeighborhoodEstimated Value: $210,000 - $224,000
2
Beds
2
Baths
1,615
Sq Ft
$134/Sq Ft
Est. Value
About This Home
This home is located at 1968 Cheshire Commons Ct Unit 2, Columbus, OH 43229 and is currently estimated at $215,781, approximately $133 per square foot. 1968 Cheshire Commons Ct Unit 2 is a home located in Franklin County with nearby schools including Northgate Intermediate, Alpine Elementary School, and Woodward Park Middle School.
Ownership History
Date
Name
Owned For
Owner Type
Purchase Details
Closed on
Sep 25, 2009
Sold by
Olon Marie A
Bought by
Allen Clarence E
Current Estimated Value
Home Financials for this Owner
Home Financials are based on the most recent Mortgage that was taken out on this home.
Original Mortgage
$93,082
Outstanding Balance
$61,121
Interest Rate
5.19%
Mortgage Type
FHA
Estimated Equity
$154,660
Purchase Details
Closed on
Oct 25, 1999
Sold by
Gildea Brian C
Bought by
Olon Marie A
Home Financials for this Owner
Home Financials are based on the most recent Mortgage that was taken out on this home.
Original Mortgage
$89,700
Interest Rate
7.87%
Mortgage Type
Purchase Money Mortgage
Purchase Details
Closed on
Jul 5, 1989
Purchase Details
Closed on
Jun 1, 1984
Create a Home Valuation Report for This Property
The Home Valuation Report is an in-depth analysis detailing your home's value as well as a comparison with similar homes in the area
Home Values in the Area
Average Home Value in this Area
Purchase History
| Date | Buyer | Sale Price | Title Company |
|---|---|---|---|
| Allen Clarence E | $94,800 | Stewart Tit | |
| Olon Marie A | $94,500 | Preferred Title Agency Inc | |
| -- | $69,900 | -- | |
| -- | $63,900 | -- |
Source: Public Records
Mortgage History
| Date | Status | Borrower | Loan Amount |
|---|---|---|---|
| Open | Allen Clarence E | $93,082 | |
| Previous Owner | Olon Marie A | $89,700 |
Source: Public Records
Tax History Compared to Growth
Tax History
| Year | Tax Paid | Tax Assessment Tax Assessment Total Assessment is a certain percentage of the fair market value that is determined by local assessors to be the total taxable value of land and additions on the property. | Land | Improvement |
|---|---|---|---|---|
| 2024 | $2,743 | $61,110 | $9,450 | $51,660 |
| 2023 | $2,708 | $61,110 | $9,450 | $51,660 |
| 2022 | $2,057 | $39,660 | $5,920 | $33,740 |
| 2021 | $2,061 | $39,660 | $5,920 | $33,740 |
| 2020 | $2,063 | $39,660 | $5,920 | $33,740 |
| 2019 | $1,851 | $30,520 | $4,550 | $25,970 |
| 2018 | $1,833 | $30,520 | $4,550 | $25,970 |
| 2017 | $1,850 | $30,520 | $4,550 | $25,970 |
| 2016 | $2,003 | $30,240 | $3,920 | $26,320 |
| 2015 | $1,818 | $30,240 | $3,920 | $26,320 |
| 2014 | $1,823 | $30,240 | $3,920 | $26,320 |
| 2013 | $999 | $33,600 | $4,340 | $29,260 |
Source: Public Records
Map
Nearby Homes
- 6496 Hearthstone Ave
- 6448 Sharon Woods Blvd Unit B
- 1947 Rockdale Dr Unit 33
- 2120 Willowick Dr Unit B
- 6355 Johnanne St
- 6658 Walbridge St
- 6407 Skywae Dr
- 6245 Sharon Woods Blvd
- 1635 Tendril Ct
- 2197 Bayfield Dr
- 6342 Bellmeadow Dr
- 6458 Faircrest Rd
- 6407 Faircrest Rd
- 2292 Laurelwood Dr Unit 2292L
- 6048 Pinemoor St
- 1421 Bosworth Place
- 1409 Bosworth Place
- 1549 Alpine Dr
- 2250 Webster Canyon Ct
- 1322 Bolenhill Ct
- 1970 Cheshire Commons Ct
- 1970 Cheshire Commons Ct Unit 1
- 1966 Cheshire Commons Ct
- 1966 Cheshire Commons Ct Unit 3
- 1964 Cheshire Commons Ct
- 1964 Cheshire Commons Ct Unit 4
- 1962 Cheshire Commons Ct
- 1960 Cheshire Commons Ct Unit 6
- 6501 Sharon Woods Blvd
- 6551 Hearthstone Ave
- 6535 Hearthstone Ave
- 6543 Hearthstone Ave
- 6529 Hearthstone Ave
- 6521 Hearthstone Ave
- 6500 Sharon Woods Blvd Unit 3A
- 6544 Hearthstone Ave
- 6479 Sharon Woods Blvd
- 6494 Sharon Woods Blvd Unit 3B
- 6494 Sharon Woods Blvd Unit B
- 6552 Hearthstone Ave