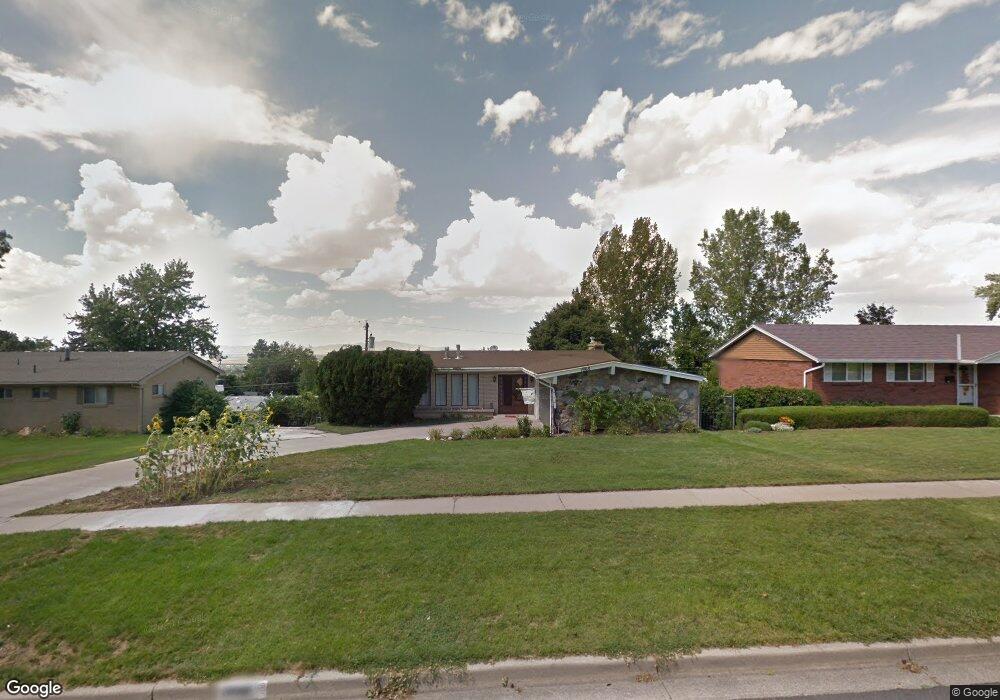
1968 S Davis Blvd Bountiful, UT 84010
Estimated Value: $560,000 - $630,000
5
Beds
3
Baths
2,746
Sq Ft
$216/Sq Ft
Est. Value
About This Home
This home is located at 1968 S Davis Blvd, Bountiful, UT 84010 and is currently estimated at $593,172, approximately $216 per square foot. 1968 S Davis Blvd is a home located in Davis County with nearby schools including Muir School, Mueller Park Junior High School, and Bountiful High School.
Ownership History
Date
Name
Owned For
Owner Type
Purchase Details
Closed on
Apr 24, 2019
Sold by
Thompson Douglas P
Bought by
Doug Thompson and Doug Calia Thompson Rlt
Current Estimated Value
Purchase Details
Closed on
Feb 16, 2012
Sold by
Thompson Douglas P
Bought by
Thompson Douglas P
Home Financials for this Owner
Home Financials are based on the most recent Mortgage that was taken out on this home.
Original Mortgage
$180,000
Interest Rate
3.84%
Mortgage Type
New Conventional
Purchase Details
Closed on
Sep 8, 2010
Sold by
Thompson Douglas P and Thompson David P
Bought by
Thompson Douglas P
Home Financials for this Owner
Home Financials are based on the most recent Mortgage that was taken out on this home.
Original Mortgage
$180,000
Interest Rate
4.48%
Mortgage Type
New Conventional
Create a Home Valuation Report for This Property
The Home Valuation Report is an in-depth analysis detailing your home's value as well as a comparison with similar homes in the area
Purchase History
| Date | Buyer | Sale Price | Title Company |
|---|---|---|---|
| Doug Thompson | -- | None Available | |
| Thompson Douglas P | -- | Cottonwood Title In | |
| Thompson Douglas P | -- | Cottonwood Title Ins Agency |
Source: Public Records
Mortgage History
| Date | Status | Borrower | Loan Amount |
|---|---|---|---|
| Closed | Thompson Douglas P | $180,000 | |
| Closed | Thompson Douglas P | $180,000 |
Source: Public Records
Tax History
| Year | Tax Paid | Tax Assessment Tax Assessment Total Assessment is a certain percentage of the fair market value that is determined by local assessors to be the total taxable value of land and additions on the property. | Land | Improvement |
|---|---|---|---|---|
| 2025 | $3,076 | $280,500 | $129,600 | $150,900 |
| 2024 | $2,846 | $268,950 | $115,007 | $153,943 |
| 2023 | $2,736 | $469,000 | $212,364 | $256,636 |
| 2022 | $2,906 | $273,900 | $116,171 | $157,729 |
| 2021 | $2,486 | $357,000 | $152,003 | $204,997 |
| 2020 | $2,201 | $317,000 | $130,017 | $186,983 |
| 2019 | $2,231 | $314,000 | $138,482 | $175,518 |
| 2018 | $2,067 | $286,000 | $135,772 | $150,228 |
| 2016 | $1,779 | $133,210 | $47,340 | $85,870 |
| 2015 | $1,749 | $123,640 | $47,340 | $76,300 |
| 2014 | $1,807 | $131,917 | $47,340 | $84,577 |
| 2013 | -- | $119,562 | $51,700 | $67,862 |
Source: Public Records
Map
Nearby Homes
- 1886 S Jeri Dr
- 2059 S 350 E Unit 6
- 2053 S 350 E Unit 7
- 295 E 2050 S Unit 1
- 2038 S 350 E Unit 3
- 2046 S 350 E Unit 4
- 320 E 2100 S
- 296 E 2050 S Unit 2
- 1761 S Davis Blvd
- 631 E 1700 S
- 761 San Simeon Way
- 188 E 2050 S Unit D3
- 2273 S 200 E
- 288 E 1650 S
- 2292 S 250 E
- 831 E San Simeon Way S
- 2136 S 900 E
- 380 E 1500 S
- 994 Deborah Dr
- 110 2250 S
- 1982 S Davis Blvd
- 1954 S Davis Blvd
- 1955 Spring Creek Dr
- 1965 Spring Creek Dr
- 1945 Spring Creek Dr
- 1996 S Davis Blvd
- 1987 S Davis Blvd
- 1944 S Davis Blvd
- 1975 Spring Creek Dr
- 1999 S Davis Blvd
- 1925 Spring Creek Dr
- 1963 S Davis Blvd
- 2010 S Davis Blvd
- 2013 S Davis Blvd
- 1962 S Spring Creek Dr
- 1950 Spring Creek Dr
- 1950 Spring Creek Dr Unit 64
- 1962 Spring Creek Dr
- 1936 Spring Creek Dr
- 2006 Bonneview Dr
Your Personal Tour Guide
Ask me questions while you tour the home.