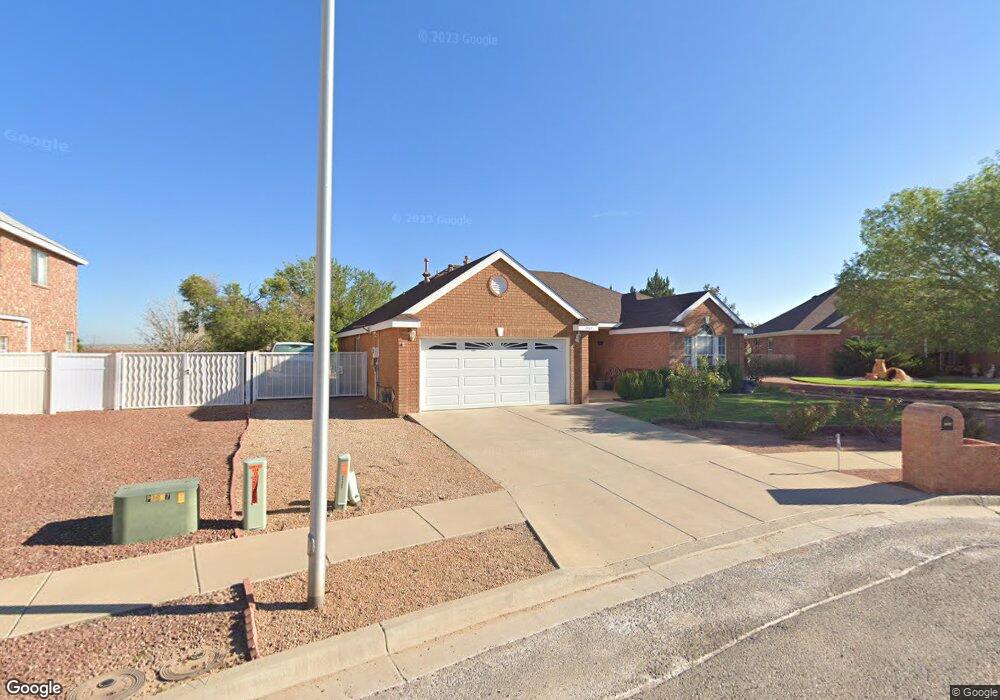
1969 Cerro Crest Ct NW Los Lunas, NM 87031
Estimated Value: $328,000 - $388,000
3
Beds
2
Baths
1,896
Sq Ft
$191/Sq Ft
Est. Value
About This Home
This home is located at 1969 Cerro Crest Ct NW, Los Lunas, NM 87031 and is currently estimated at $362,479, approximately $191 per square foot. 1969 Cerro Crest Ct NW is a home located in Valencia County with nearby schools including Katherine Gallegos Elementary School, Los Lunas Middle School, and Los Lunas High School.
Ownership History
Date
Name
Owned For
Owner Type
Purchase Details
Closed on
Jul 2, 2014
Sold by
Williams Ricky Scott
Bought by
Esch Justin
Current Estimated Value
Home Financials for this Owner
Home Financials are based on the most recent Mortgage that was taken out on this home.
Original Mortgage
$174,750
Outstanding Balance
$133,257
Interest Rate
4.19%
Mortgage Type
New Conventional
Estimated Equity
$229,222
Purchase Details
Closed on
Jul 12, 2012
Sold by
Williams Laura Ann
Bought by
Williams Ricky Scott
Purchase Details
Closed on
Nov 17, 2010
Sold by
Castaneda Susan
Bought by
Williams Ricky Scott and Williams Laura A
Home Financials for this Owner
Home Financials are based on the most recent Mortgage that was taken out on this home.
Original Mortgage
$192,980
Interest Rate
4.27%
Mortgage Type
FHA
Create a Home Valuation Report for This Property
The Home Valuation Report is an in-depth analysis detailing your home's value as well as a comparison with similar homes in the area
Home Values in the Area
Average Home Value in this Area
Purchase History
| Date | Buyer | Sale Price | Title Company |
|---|---|---|---|
| Esch Justin | -- | Old Republic Natl Title Co | |
| Williams Ricky Scott | -- | None Available | |
| Williams Ricky Scott | -- | -- |
Source: Public Records
Mortgage History
| Date | Status | Borrower | Loan Amount |
|---|---|---|---|
| Open | Esch Justin | $174,750 | |
| Previous Owner | Williams Ricky Scott | $192,980 |
Source: Public Records
Tax History Compared to Growth
Tax History
| Year | Tax Paid | Tax Assessment Tax Assessment Total Assessment is a certain percentage of the fair market value that is determined by local assessors to be the total taxable value of land and additions on the property. | Land | Improvement |
|---|---|---|---|---|
| 2024 | $2,042 | $67,638 | $10,000 | $57,638 |
| 2023 | $1,964 | $65,668 | $10,000 | $55,668 |
| 2022 | $1,926 | $63,756 | $10,000 | $53,756 |
| 2021 | $1,882 | $61,899 | $10,300 | $51,599 |
| 2020 | $1,856 | $60,096 | $10,000 | $50,096 |
| 2019 | $1,866 | $60,096 | $10,000 | $50,096 |
| 2018 | $1,834 | $60,096 | $10,000 | $50,096 |
| 2017 | $1,806 | $60,096 | $10,000 | $50,096 |
| 2016 | $1,808 | $60,096 | $10,000 | $50,096 |
| 2015 | -- | $60,096 | $10,000 | $50,096 |
| 2013 | -- | $66,324 | $11,583 | $54,741 |
| 2011 | -- | $193,179 | $33,738 | $159,441 |
Source: Public Records
Map
Nearby Homes
- 1675 Bosque Vista Loop NW
- 1854 Valle Vista Rd NW
- 1811 Valle Vista Rd NW
- 1672 Tierra Verde Loop
- The Gabrielle Plan at Mil Colores at Fiesta
- The Anastasia Plan at Mil Colores at Fiesta
- The Bella Plan at Mil Colores at Fiesta
- 1469 Valle de Colores Rd NW
- 1592 Valle de Colores Rd NW
- 1745 Villa Contesa
- 1520 Valle de Colores Rd NW
- 1616 Valle de Colores Rd NW
- 1457 Valle de Colores Rd NW
- 1556 Valle de Colores NW
- 1493 Valle de Colores Rd NW
- 1641 Tierra Verde Loop
- 1532 Valle de Colores NW
- 1616 Valle de Colores
- 1520 Valle de Colores
- 1304 Valle de Colores Rd NW
- 1961 Cerro Crest Ct NW
- 1977 Cerro Crest Ct NW
- 1955 Cerro Crest Ct NW
- 1970 Cerro Crest Ct NW
- 1962 Cerro Crest Ct NW
- 1956 Cerro Crest Ct NW
- 1948 Cerro Crest Ct NW
- 1597 Alto Colores St NW
- 1549 Alto Colores Loop NW
- 1947 Cerro Crest Ct NW
- 1900 Valle Vista Rd NW
- 1872 Valle Vista Rd NW
- 1940 Cerro Crest Ct NW
- 1609 Alto Colores
- 1537 Alto Colores St
- 1561 Alto Colores Loop NW
- 1621 Alto Colores St NW
- 1866 Valle Vista Rd NW
- 1906 Valle Vista Rd NW
- 1939 Cerro Crest Ct NW