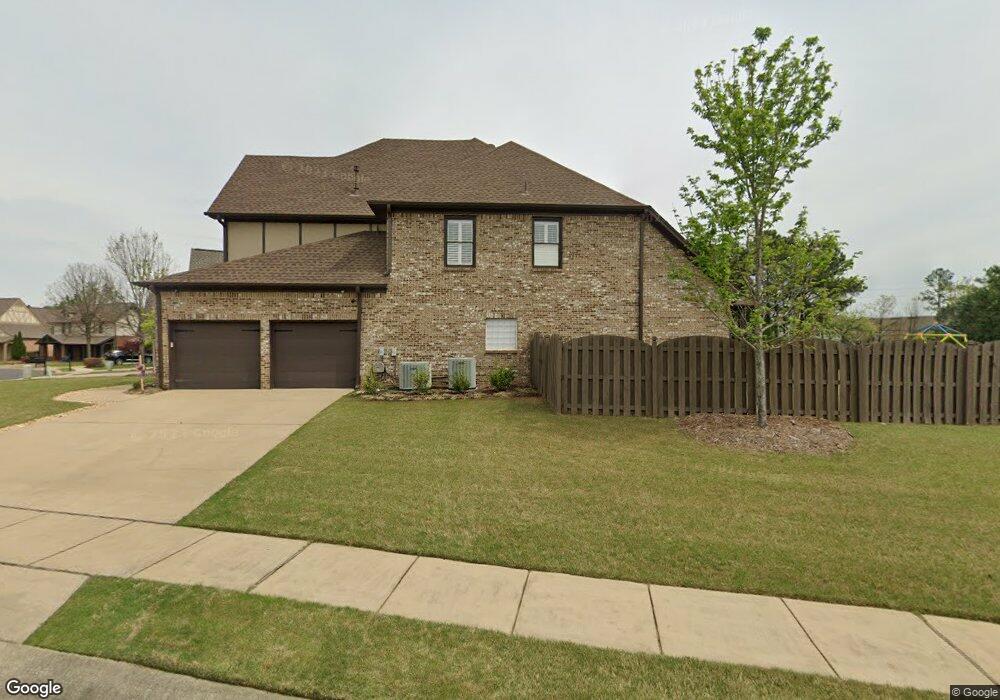
1969 Chalybe Way Unit C240 Birmingham, AL 35226
Ross Bridge NeighborhoodEstimated Value: $510,000 - $581,000
4
Beds
4
Baths
3,886
Sq Ft
$139/Sq Ft
Est. Value
About This Home
This home is located at 1969 Chalybe Way Unit C240, Birmingham, AL 35226 and is currently estimated at $541,576, approximately $139 per square foot. 1969 Chalybe Way Unit C240 is a home located in Jefferson County with nearby schools including Deer Valley Elementary School, Robert F. Bumpus Middle School, and Hoover High School.
Ownership History
Date
Name
Owned For
Owner Type
Purchase Details
Closed on
Nov 13, 2018
Sold by
Meeks Noah Daniel
Bought by
Haskins Meeks Noah Daniel and Haskins Meeks Elaine
Current Estimated Value
Purchase Details
Closed on
Jul 8, 2016
Sold by
Cartus Financial Corp
Bought by
Meeks Noah Daniel
Home Financials for this Owner
Home Financials are based on the most recent Mortgage that was taken out on this home.
Original Mortgage
$350,550
Interest Rate
3.48%
Mortgage Type
New Conventional
Purchase Details
Closed on
May 27, 2016
Sold by
Naro Christopher
Bought by
Cartus Financial Corp
Home Financials for this Owner
Home Financials are based on the most recent Mortgage that was taken out on this home.
Original Mortgage
$350,550
Interest Rate
3.48%
Mortgage Type
New Conventional
Create a Home Valuation Report for This Property
The Home Valuation Report is an in-depth analysis detailing your home's value as well as a comparison with similar homes in the area
Home Values in the Area
Average Home Value in this Area
Purchase History
| Date | Buyer | Sale Price | Title Company |
|---|---|---|---|
| Haskins Meeks Noah Daniel | -- | -- | |
| Meeks Noah Daniel | $369,000 | -- | |
| Cartus Financial Corp | $369,000 | -- |
Source: Public Records
Mortgage History
| Date | Status | Borrower | Loan Amount |
|---|---|---|---|
| Previous Owner | Meeks Noah Daniel | $350,550 | |
| Previous Owner | Cartus Financial Corp | $350,550 |
Source: Public Records
Tax History Compared to Growth
Tax History
| Year | Tax Paid | Tax Assessment Tax Assessment Total Assessment is a certain percentage of the fair market value that is determined by local assessors to be the total taxable value of land and additions on the property. | Land | Improvement |
|---|---|---|---|---|
| 2024 | $3,769 | $53,680 | -- | -- |
| 2022 | $3,091 | $43,300 | $10,100 | $33,200 |
| 2021 | $2,970 | $41,640 | $10,100 | $31,540 |
| 2020 | $2,912 | $40,690 | $10,100 | $30,590 |
| 2019 | $2,970 | $41,640 | $0 | $0 |
| 2018 | $2,767 | $38,840 | $0 | $0 |
| 2017 | $2,683 | $37,680 | $0 | $0 |
| 2016 | $2,577 | $36,220 | $0 | $0 |
| 2015 | $2,577 | $36,220 | $0 | $0 |
| 2014 | $2,517 | $36,100 | $0 | $0 |
| 2013 | $2,517 | $36,100 | $0 | $0 |
Source: Public Records
Map
Nearby Homes
- 2254 Chalybe Trail
- 2125 Chalybe Dr
- 2055 Chalybe Way
- 2376 Chalybe Trail
- 2078 Greenside Way
- 2217 Chalybe Dr
- 209 Melbourne Cir Unit 320
- 2012 Shannon Rd Unit 1
- 3748 Village Center Way
- 2424 Chalybe Trail
- The Lakewood 3B Plan at Primrose at Everlee - Classic
- The Hartley 3B Plan at Primrose at Everlee - Classic
- The Hartley 3C Plan at Primrose at Everlee - Classic
- The Channing 3D Plan at Primrose at Everlee - Classic
- The Channing 3C Plan at Primrose at Everlee - Classic
- The Florence 3A Plan at Primrose at Everlee - Classic
- The Florence 3B Plan at Primrose at Everlee - Classic
- The Hartley 3A Plan at Primrose at Everlee - Classic
- The Berkshire 3C Plan at Primrose at Everlee - Classic
- The Berkshire 3B Plan at Primrose at Everlee - Classic
- 1969 Chalybe Way
- 3615 Chalybe Cove
- 3615 Chalybe Cove Unit C 239
- 3619 Chalybe Cove
- 3619 Chalybe Cove Unit C238
- 3619 Chalybe Way Unit C238
- 2259 Chalybe Trail
- 2102 Chalybe Dr
- 1968 Chalybe Way
- 1968 Chalybe Way Unit 242
- 1968 Chalybe Dr Unit 242
- 1972 Chalybe Way
- 2255 Chalybe Trail
- 1964 Chalybe Way
- 3623 Chalybe Cove
- 3623 Chalybe Cove Unit C 237
- 1960 Chalybe Way
- 2273 Chalybe Trail
- 2101 Chalybe Dr
- 1976 Chalybe Way