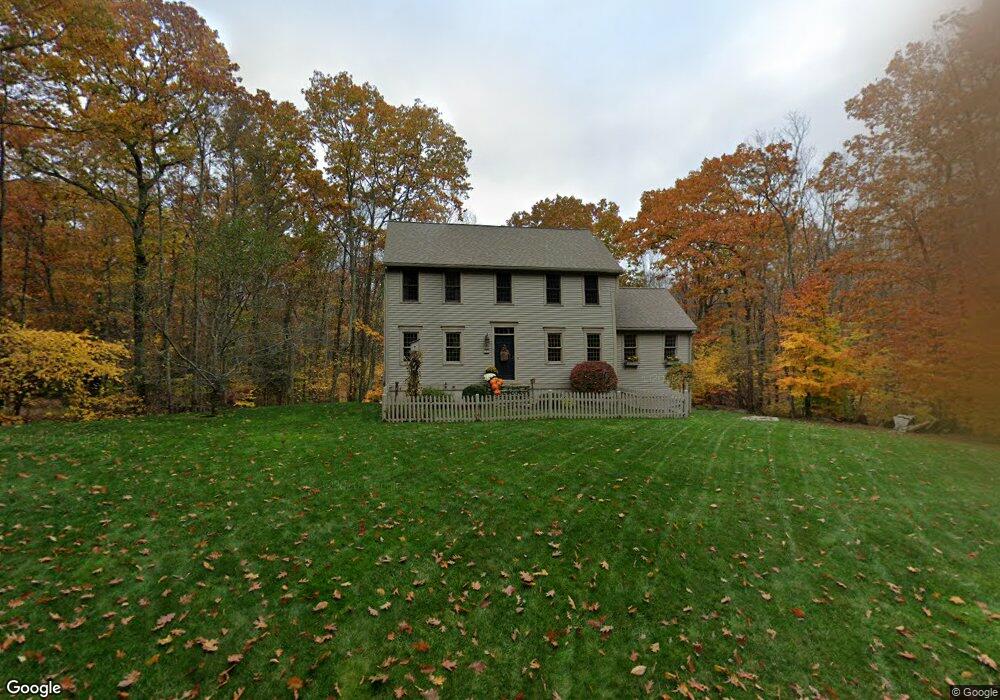
197 SE Main St Douglas, MA 01516
Estimated Value: $576,960 - $652,000
3
Beds
2
Baths
1,912
Sq Ft
$329/Sq Ft
Est. Value
About This Home
This home is located at 197 SE Main St, Douglas, MA 01516 and is currently estimated at $628,240, approximately $328 per square foot. 197 SE Main St is a home located in Worcester County with nearby schools including Douglas Primary School, Douglas Middle School, and Douglas High School.
Ownership History
Date
Name
Owned For
Owner Type
Purchase Details
Closed on
Jul 2, 2003
Sold by
Douglas Dev Group Llc
Bought by
Goncalves Jean M and Goncalves Joseph J
Current Estimated Value
Home Financials for this Owner
Home Financials are based on the most recent Mortgage that was taken out on this home.
Original Mortgage
$185,000
Outstanding Balance
$79,837
Interest Rate
5.46%
Mortgage Type
Purchase Money Mortgage
Estimated Equity
$548,403
Create a Home Valuation Report for This Property
The Home Valuation Report is an in-depth analysis detailing your home's value as well as a comparison with similar homes in the area
Home Values in the Area
Average Home Value in this Area
Purchase History
| Date | Buyer | Sale Price | Title Company |
|---|---|---|---|
| Goncalves Jean M | $301,931 | -- |
Source: Public Records
Mortgage History
| Date | Status | Borrower | Loan Amount |
|---|---|---|---|
| Open | Goncalves Jean M | $185,000 |
Source: Public Records
Tax History
| Year | Tax Paid | Tax Assessment Tax Assessment Total Assessment is a certain percentage of the fair market value that is determined by local assessors to be the total taxable value of land and additions on the property. | Land | Improvement |
|---|---|---|---|---|
| 2025 | $65 | $496,800 | $99,100 | $397,700 |
| 2024 | $6,408 | $474,000 | $90,100 | $383,900 |
| 2023 | $6,249 | $435,200 | $90,100 | $345,100 |
| 2022 | $6,322 | $386,900 | $83,300 | $303,600 |
| 2021 | $6,206 | $371,200 | $79,300 | $291,900 |
| 2020 | $6,053 | $356,500 | $79,300 | $277,200 |
| 2019 | $5,875 | $335,700 | $79,300 | $256,400 |
| 2018 | $5,237 | $325,900 | $79,300 | $246,600 |
| 2017 | $5,081 | $303,900 | $82,500 | $221,400 |
| 2016 | $4,922 | $292,600 | $82,500 | $210,100 |
| 2015 | $4,816 | $292,600 | $82,500 | $210,100 |
Source: Public Records
Map
Nearby Homes
- 279 S East Main St Unit Lot 2
- 295 S East Main St Unit Lot 6
- 10 Essex St
- 240 South St
- 299 S East Main St Unit Lot 7
- 303 S East Main St Unit Lot 8
- 307 S East Main St Unit Lot 9
- 296 Yew St
- 13 Perry St
- 1 White Ct
- 48 Walnut St
- 99 Maple St
- 32 Hemlock St
- 11 Old Farm Rd
- 38 Hemlock St
- 153 Davis St
- 59 Old Farm Rd
- 3 S East Main St
- 41 Martin Rd
- 405 West St
- 209 SE Main St
- 196 SE Main St
- 211 SE Main St
- 200 SE Main St
- 54 S East Main St
- 183 S East Main St
- 0 S East Main St
- 269 S East Main St
- 204 SE Main St
- 213 SE Main St
- 215 SE Main St
- 210 SE Main St
- 217 SE Main St
- 176 SE Main St
- 218 SE Main St
- 218 SE Main St
- 218 S East Main St
- 171 SE Main St
- 171 S East Main St
- 171 SE Main St
Your Personal Tour Guide
Ask me questions while you tour the home.