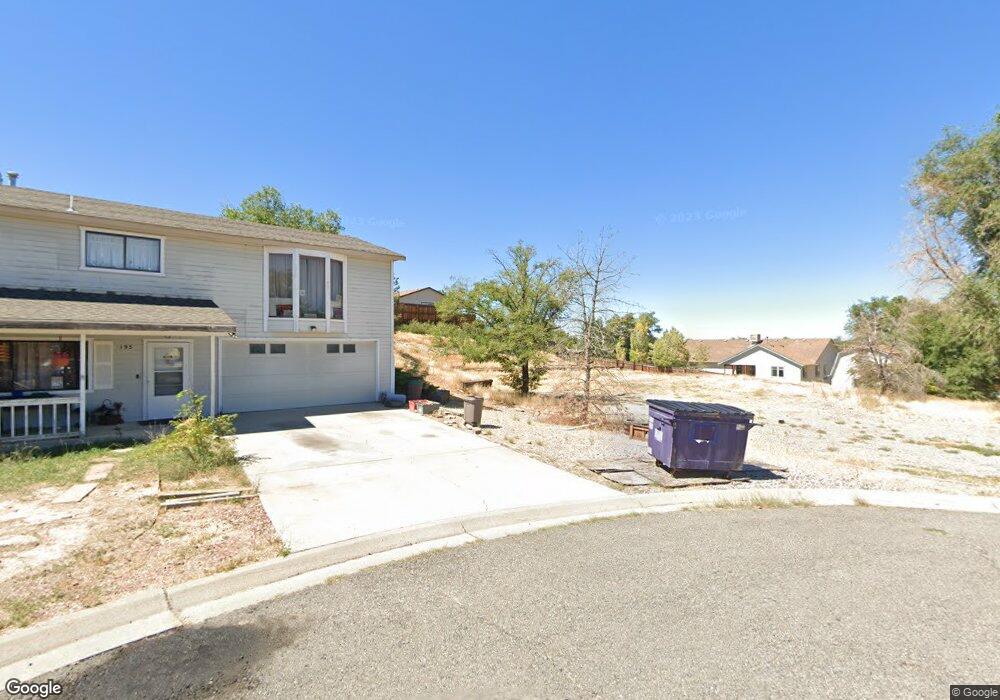
197 Sego Ct Grand Junction, CO 81503
Orchard Mesa NeighborhoodEstimated Value: $226,000 - $507,000
3
Beds
2
Baths
1,922
Sq Ft
$189/Sq Ft
Est. Value
About This Home
This home is located at 197 Sego Ct, Grand Junction, CO 81503 and is currently estimated at $363,236, approximately $188 per square foot. 197 Sego Ct is a home located in Mesa County with nearby schools including Dos Rios Elementary School, Orchard Mesa Middle School, and Grand Junction High School.
Ownership History
Date
Name
Owned For
Owner Type
Purchase Details
Closed on
Sep 30, 2005
Sold by
Noland James and Noland Shirley
Bought by
Larsen Keith A and Karnasiewicz Judith C
Current Estimated Value
Purchase Details
Closed on
Mar 12, 2003
Sold by
Quigley Robert and Quigley Michelle Gray
Bought by
Noland James and Noland Shirley
Home Financials for this Owner
Home Financials are based on the most recent Mortgage that was taken out on this home.
Original Mortgage
$135,900
Interest Rate
7.45%
Purchase Details
Closed on
Sep 27, 1993
Sold by
Rogan Edward T
Bought by
Larsen Keith A
Home Financials for this Owner
Home Financials are based on the most recent Mortgage that was taken out on this home.
Original Mortgage
$8,400
Interest Rate
1%
Mortgage Type
Seller Take Back
Purchase Details
Closed on
Apr 23, 1990
Sold by
Schaller Heli
Bought by
Larsen Keith A
Purchase Details
Closed on
Dec 19, 1988
Sold by
Campbell Laura M
Bought by
Larsen Keith A
Create a Home Valuation Report for This Property
The Home Valuation Report is an in-depth analysis detailing your home's value as well as a comparison with similar homes in the area
Home Values in the Area
Average Home Value in this Area
Purchase History
| Date | Buyer | Sale Price | Title Company |
|---|---|---|---|
| Larsen Keith A | $154,450 | Abstract & Title Company Of | |
| Noland James | $151,000 | Meridian Land Title Llc | |
| Larsen Keith A | $86,000 | -- | |
| Quigley Robert | $80,000 | None Listed On Document | |
| Larsen Keith A | $73,500 | -- | |
| Larsen Keith A | $63,400 | -- |
Source: Public Records
Mortgage History
| Date | Status | Borrower | Loan Amount |
|---|---|---|---|
| Previous Owner | Noland James | $135,900 | |
| Previous Owner | Quigley Robert | $8,400 |
Source: Public Records
Tax History Compared to Growth
Tax History
| Year | Tax Paid | Tax Assessment Tax Assessment Total Assessment is a certain percentage of the fair market value that is determined by local assessors to be the total taxable value of land and additions on the property. | Land | Improvement |
|---|---|---|---|---|
| 2024 | $1,282 | $18,140 | $18,140 | -- |
| 2023 | $1,282 | $18,140 | $18,140 | $0 |
| 2022 | $474 | $6,600 | $3,130 | $3,470 |
| 2021 | $1,033 | $15,180 | $3,220 | $11,960 |
| 2020 | $1,003 | $15,100 | $2,860 | $12,240 |
| 2019 | $913 | $15,100 | $2,860 | $12,240 |
| 2018 | $842 | $12,510 | $2,520 | $9,990 |
| 2017 | $743 | $12,510 | $2,520 | $9,990 |
| 2016 | $743 | $12,480 | $2,790 | $9,690 |
| 2015 | $762 | $12,480 | $2,790 | $9,690 |
| 2014 | $756 | $12,380 | $2,790 | $9,590 |
Source: Public Records
Map
Nearby Homes
- 194 Sego Ct
- 2731 Storm Ave
- 2733 Storm Ave
- 2735 Storm Ave
- 2734 Radiant Ave
- 2742 Radiant Ave
- 2737 Storm Ave
- Illuminate Plan at Shadow Mesa
- Eclipse B Plan at Shadow Mesa
- Halo Plan at Shadow Mesa
- Silhouette Plan at Shadow Mesa
- Sirius Plan at Shadow Mesa
- Sorano B Plan at Shadow Mesa
- Sorano A Plan at Shadow Mesa
- Aura Plan at Shadow Mesa
- Radiant Plan at Shadow Mesa
- Harmattan Plan at Shadow Mesa
- Calo Plan at Shadow Mesa
- Eclipse A Plan at Shadow Mesa
- Twilight Plan at Shadow Mesa