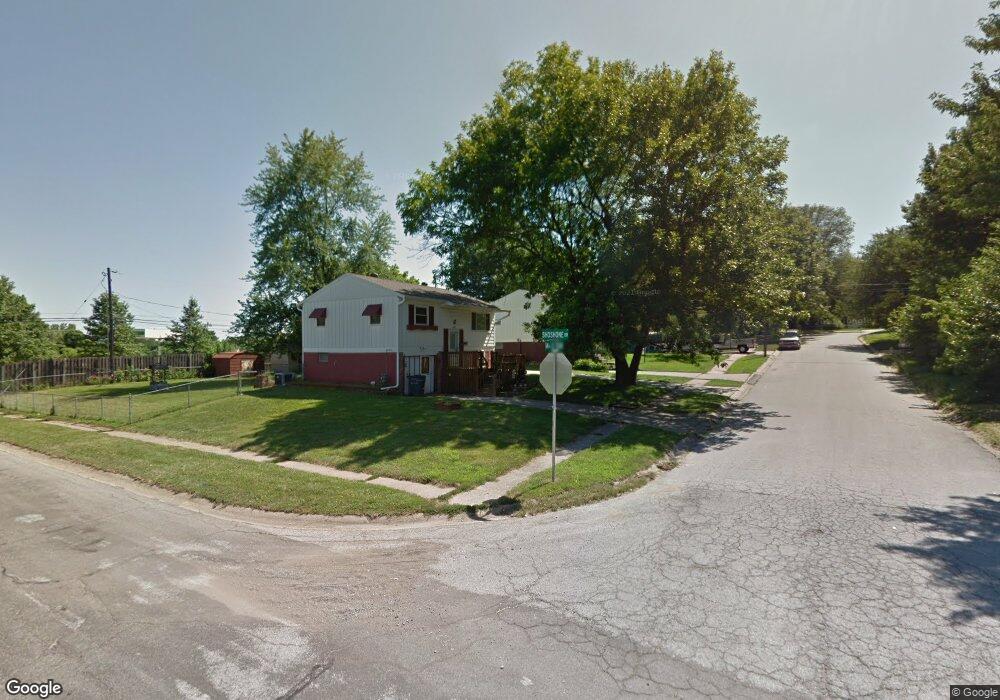
19707 E 14th Terrace N Independence, MO 64056
Ripley NeighborhoodEstimated Value: $208,549 - $229,000
3
Beds
2
Baths
1,014
Sq Ft
$216/Sq Ft
Est. Value
About This Home
This home is located at 19707 E 14th Terrace N, Independence, MO 64056 and is currently estimated at $219,137, approximately $216 per square foot. 19707 E 14th Terrace N is a home located in Jackson County with nearby schools including Fort Osage High School.
Ownership History
Date
Name
Owned For
Owner Type
Purchase Details
Closed on
Feb 25, 2008
Sold by
M & I Bank Fsb
Bought by
Thompson Tiffney L and Thompson Patrick W
Current Estimated Value
Home Financials for this Owner
Home Financials are based on the most recent Mortgage that was taken out on this home.
Original Mortgage
$98,947
Outstanding Balance
$60,461
Interest Rate
5.47%
Mortgage Type
FHA
Estimated Equity
$158,676
Purchase Details
Closed on
Oct 4, 2007
Sold by
Penny Larry and Penny Wanda
Bought by
M & I Bank Fsb
Purchase Details
Closed on
Apr 24, 2006
Sold by
Matney Richard and Matney Vickie
Bought by
Penny Larry and Penny Wanda
Home Financials for this Owner
Home Financials are based on the most recent Mortgage that was taken out on this home.
Original Mortgage
$119,100
Interest Rate
6.5%
Mortgage Type
Fannie Mae Freddie Mac
Purchase Details
Closed on
Jun 21, 2004
Sold by
Matney Karen
Bought by
Matney Richard
Create a Home Valuation Report for This Property
The Home Valuation Report is an in-depth analysis detailing your home's value as well as a comparison with similar homes in the area
Home Values in the Area
Average Home Value in this Area
Purchase History
We collect this data history from publicly available records. To have your information removed, we recommend requesting removal directly through your county’s website.
| Date | Buyer | Sale Price | Title Company |
|---|---|---|---|
| Thompson Tiffney L | $100,500 | Chicago Title | |
| M & I Bank Fsb | $96,648 | Continental Title Company | |
| Penny Larry | -- | Metro One Title | |
| Matney Richard | -- | -- |
Source: Public Records
Mortgage History
We collect this data history from publicly available records. To have your information removed, we recommend requesting removal directly through your county’s website.
| Date | Status | Borrower | Loan Amount |
|---|---|---|---|
| Open | Thompson Tiffney L | $98,947 | |
| Previous Owner | Penny Larry | $119,100 |
Source: Public Records
Tax History
| Year | Tax Paid | Tax Assessment Tax Assessment Total Assessment is a certain percentage of the fair market value that is determined by local assessors to be the total taxable value of land and additions on the property. | Land | Improvement |
|---|---|---|---|---|
| 2025 | $2,429 | $26,635 | $4,625 | $22,010 |
| 2024 | $2,429 | $30,590 | $4,034 | $26,556 |
| 2023 | $2,418 | $30,590 | $3,870 | $26,720 |
| 2022 | $1,676 | $20,140 | $4,161 | $15,979 |
| 2021 | $1,675 | $20,140 | $4,161 | $15,979 |
| 2020 | $1,620 | $19,213 | $4,161 | $15,052 |
| 2019 | $1,604 | $19,213 | $4,161 | $15,052 |
| 2018 | $1,541 | $18,338 | $3,039 | $15,299 |
| 2017 | $1,541 | $18,338 | $3,039 | $15,299 |
| 2016 | $1,376 | $17,879 | $2,793 | $15,086 |
| 2014 | $1,327 | $17,152 | $2,780 | $14,372 |
Source: Public Records
Map
Nearby Homes
- 19706 E 14th St N
- 19704 E 14th Terrace N
- 1410 N Holland Dr
- 1336 N Holland Dr
- 1325 N Holland Ct
- 1207 N Glenview Ave
- 1313 N Holland Dr
- 1232 N Sioux Ct
- 1130 N Glenview Ave
- 19212 E 15th St N
- 1219 N Heartland Ave
- 20405 E 15th Terrace N
- 19613 E 11th Terrace N
- 20408 E 15th Terrace N
- 1121 N Old Mill Rd
- 20242 E 17th Street Ct N
- 19610 E Bundschu Rd
- 1819 N York St
- 1018 N Old Mill Rd
- 18729 E 13th Terrace Ct N
- 19709 E 14th Terrace N
- 19705 E 14th Terrace N
- 19704 E 14th St N
- 19708 E 14th St N
- 19711 E 14th Terrace N
- 19702 E 14th St N
- 19706 E 14th Terrace N
- 19706 E 14th Terrace N
- 19710 E 14th St N
- 19710 E 14th Terrace N
- 19701 E 14th Terrace N
- 19708 E 14th Terrace N
- 19800 E 14th St N
- 19702 E 14th Terrace N
- 19700 E 14th St N
- 1415 N Glen Ellyn St
- 19804 E 14th St N
- 19802 E 14th St N
- 19707 E 14th St N
- 19705 E 14th St N
Your Personal Tour Guide
Ask me questions while you tour the home.