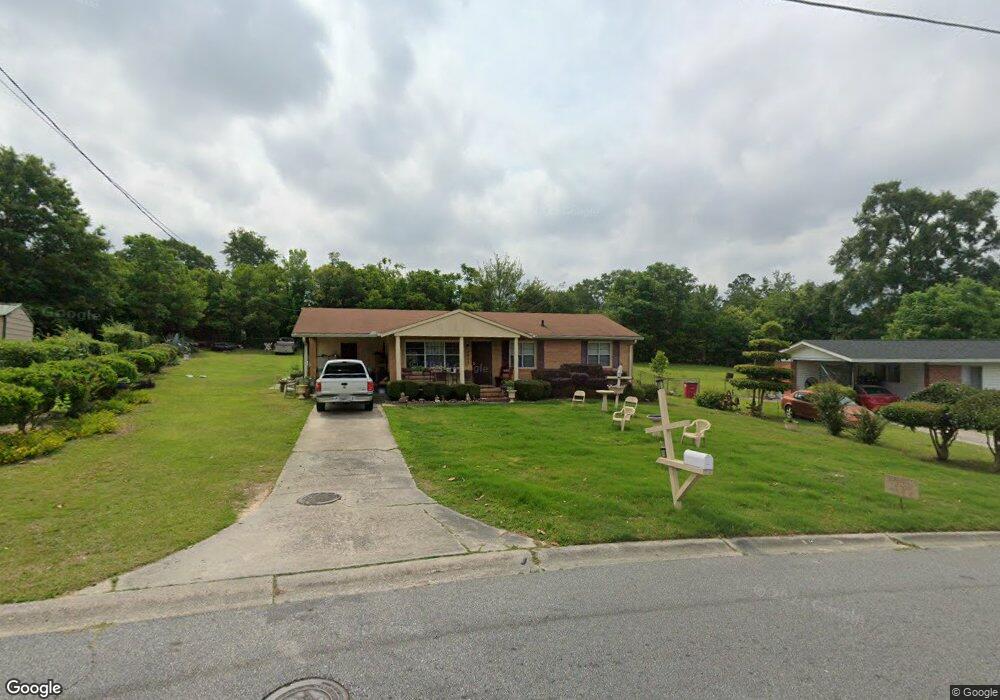
1971 Canterbury Rd Macon, GA 31206
Estimated Value: $112,000 - $119,000
3
Beds
2
Baths
1,000
Sq Ft
$115/Sq Ft
Est. Value
About This Home
This home is located at 1971 Canterbury Rd, Macon, GA 31206 and is currently estimated at $115,389, approximately $115 per square foot. 1971 Canterbury Rd is a home located in Bibb County with nearby schools including Hartley Elementary School, Southwest High School, and Cirrus Charter Academy.
Ownership History
Date
Name
Owned For
Owner Type
Purchase Details
Closed on
Jun 29, 2009
Sold by
M & M Restoration Group Llc
Bought by
Morgan Elijah and Morgan Phyllis
Current Estimated Value
Home Financials for this Owner
Home Financials are based on the most recent Mortgage that was taken out on this home.
Original Mortgage
$49,300
Interest Rate
4.79%
Mortgage Type
Unknown
Purchase Details
Closed on
May 12, 2009
Sold by
M & M Restoration Group Llc
Bought by
Morgan Elijah and Morgan Phyllis Stanley
Home Financials for this Owner
Home Financials are based on the most recent Mortgage that was taken out on this home.
Original Mortgage
$49,300
Interest Rate
4.79%
Mortgage Type
Unknown
Purchase Details
Closed on
Aug 11, 2008
Sold by
Neubauer Brandy W
Bought by
M & M Restoration Group Llc
Purchase Details
Closed on
May 19, 2006
Sold by
Lowe Patricia
Bought by
Ncubauer Brandy W
Purchase Details
Closed on
May 18, 2006
Sold by
Lowe Patricia
Bought by
Lowe Patricia and Neubauer Brandy W
Create a Home Valuation Report for This Property
The Home Valuation Report is an in-depth analysis detailing your home's value as well as a comparison with similar homes in the area
Home Values in the Area
Average Home Value in this Area
Purchase History
| Date | Buyer | Sale Price | Title Company |
|---|---|---|---|
| Morgan Elijah | -- | None Available | |
| Morgan Elijah | -- | None Available | |
| M & M Restoration Group Llc | $20,000 | None Available | |
| Ncubauer Brandy W | -- | None Available | |
| Lowe Patricia | -- | None Available |
Source: Public Records
Mortgage History
| Date | Status | Borrower | Loan Amount |
|---|---|---|---|
| Closed | Morgan Elijah | $49,300 |
Source: Public Records
Tax History Compared to Growth
Tax History
| Year | Tax Paid | Tax Assessment Tax Assessment Total Assessment is a certain percentage of the fair market value that is determined by local assessors to be the total taxable value of land and additions on the property. | Land | Improvement |
|---|---|---|---|---|
| 2025 | $1,381 | $56,207 | $5,760 | $50,447 |
| 2024 | $1,427 | $56,207 | $5,760 | $50,447 |
| 2023 | $1,290 | $50,802 | $5,760 | $45,042 |
| 2022 | $1,337 | $38,625 | $4,647 | $33,978 |
| 2021 | $1,148 | $30,199 | $3,541 | $26,658 |
| 2020 | $879 | $22,650 | $2,656 | $19,994 |
| 2019 | $616 | $15,734 | $2,656 | $13,078 |
| 2018 | $1,123 | $15,734 | $2,656 | $13,078 |
| 2017 | $589 | $15,734 | $2,656 | $13,078 |
| 2016 | $544 | $15,734 | $2,656 | $13,078 |
| 2015 | $724 | $14,776 | $2,656 | $12,120 |
| 2014 | $832 | $14,776 | $2,656 | $12,120 |
Source: Public Records
Map
Nearby Homes
- 1740 Downing Cir
- 1504 Berkshire Dr
- 3254 Markwood Dr
- 2350 Anthony Terrace
- 808 Patton Ave
- 800 Patton Ave
- 815 Edwards Ave
- 3339 Markwood Dr
- 736 Key St
- 2249 Lowe St
- 742 Grayson Ave
- 1545 Anthony Rd
- 717 Patton Ave
- 777 Grosso Ave
- 755 Grosso Ave
- 1196 Harley St
- 1870 Bethlea Ave
- 1740 Dixon Dr
- 1727 Eveline Ave
- 1049 Anthony Rd
- 1963 Canterbury Rd
- 2501 Kent Dr
- 1964 Neville Way
- 2509 Kent Dr
- 1972 Neville Way
- 1956 Neville Way
- 1955 Canterbury Rd
- 1974 Canterbury Rd
- 1986 Neville Way
- 1948 Neville Way
- 1958 Canterbury Rd
- 2519 Kent Dr
- 1940 Neville Way
- 1947 Canterbury Rd
- 2053 Winston Dr
- 1950 Canterbury Rd
- 2508 Kent Dr
- 1932 Neville Way
- 2064 Winston Dr
- 1969 Neville Way