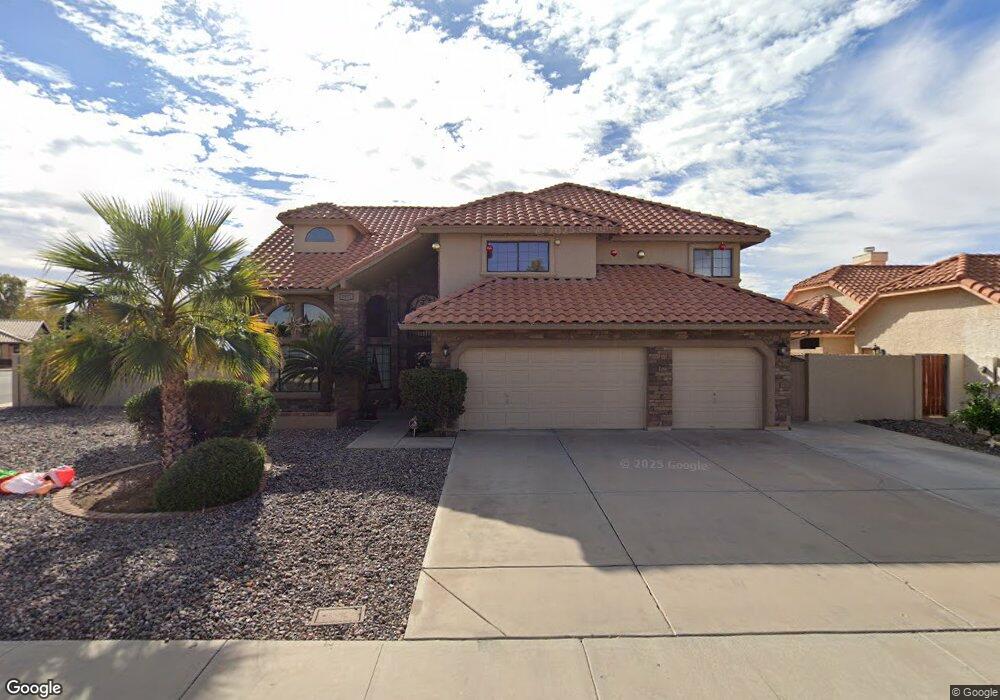
1971 E Calle Monte Vista Tempe, AZ 85284
South Tempe NeighborhoodEstimated Value: $724,434 - $886,000
--
Bed
4
Baths
2,808
Sq Ft
$290/Sq Ft
Est. Value
About This Home
This home is located at 1971 E Calle Monte Vista, Tempe, AZ 85284 and is currently estimated at $815,359, approximately $290 per square foot. 1971 E Calle Monte Vista is a home located in Maricopa County with nearby schools including C I Waggoner School, Kyrene Middle School, and Corona Del Sol High School.
Ownership History
Date
Name
Owned For
Owner Type
Purchase Details
Closed on
Apr 2, 2007
Sold by
Stough Phillip D and Stough Lisa A
Bought by
Stough Phillip D and Stough Lisa A
Current Estimated Value
Purchase Details
Closed on
Jun 1, 1994
Sold by
Grochowsky Lee and Hamby Karen
Bought by
Commonwealth Relocation Services Inc
Home Financials for this Owner
Home Financials are based on the most recent Mortgage that was taken out on this home.
Original Mortgage
$156,000
Interest Rate
6.12%
Mortgage Type
New Conventional
Purchase Details
Closed on
May 10, 1994
Sold by
Commonwealth Relocation Services Inc
Bought by
Stough Phillip D and Stough Lisa A
Home Financials for this Owner
Home Financials are based on the most recent Mortgage that was taken out on this home.
Original Mortgage
$156,000
Interest Rate
6.12%
Mortgage Type
New Conventional
Create a Home Valuation Report for This Property
The Home Valuation Report is an in-depth analysis detailing your home's value as well as a comparison with similar homes in the area
Home Values in the Area
Average Home Value in this Area
Purchase History
| Date | Buyer | Sale Price | Title Company |
|---|---|---|---|
| Stough Phillip D | -- | None Available | |
| Commonwealth Relocation Services Inc | -- | Transamerica Title Ins Co | |
| Stough Phillip D | $209,000 | Transamerica Title Ins Co |
Source: Public Records
Mortgage History
| Date | Status | Borrower | Loan Amount |
|---|---|---|---|
| Previous Owner | Stough Phillip D | $156,000 |
Source: Public Records
Tax History Compared to Growth
Tax History
| Year | Tax Paid | Tax Assessment Tax Assessment Total Assessment is a certain percentage of the fair market value that is determined by local assessors to be the total taxable value of land and additions on the property. | Land | Improvement |
|---|---|---|---|---|
| 2025 | $4,533 | $47,072 | -- | -- |
| 2024 | $4,254 | $44,830 | -- | -- |
| 2023 | $4,254 | $56,450 | $11,290 | $45,160 |
| 2022 | $4,029 | $43,860 | $8,770 | $35,090 |
| 2021 | $4,132 | $41,620 | $8,320 | $33,300 |
| 2020 | $4,028 | $40,150 | $8,030 | $32,120 |
| 2019 | $3,890 | $39,470 | $7,890 | $31,580 |
| 2018 | $3,754 | $37,000 | $7,400 | $29,600 |
| 2017 | $3,586 | $35,460 | $7,090 | $28,370 |
| 2016 | $3,628 | $36,810 | $7,360 | $29,450 |
| 2015 | $3,352 | $34,130 | $6,820 | $27,310 |
Source: Public Records
Map
Nearby Homes
- 1966 E Calle de Arcos
- 1983 E Palomino Dr
- 1962 E Ranch Rd Unit 3
- 8856 S Taylor Dr
- 2007 E Ranch Rd
- 1938 E Calle de Caballos
- 1971 E Buena Vista Dr
- 1809 E Carver Rd
- 1454 E Calle de Arcos
- 1830 E Secretariat Dr
- 2173 E La Vieve Ln
- 1739 E Knox Rd
- 1444 E Myrna Ln
- 2875 W Highland St Unit 1102
- 2875 W Highland St Unit 1112
- 1962 N Blackstone Dr
- 1861 E Krista Way
- 3165 W Golden Ln
- 8606 S Dorsey Ln
- 2050 N 90th Place
- 1967 E Calle Monte Vista
- 1967 E Calle Monte Vista
- 8740 S Kenwood Ln
- 1966 E Los Arboles Dr
- 1963 E Calle Monte Vista
- 8701 S Kenwood Ln
- 1972 E Calle Monte Vista
- 1968 E Calle Monte Vista
- 1968 E Calle Monte Vista
- 8665 S Kenwood Ln
- 1962 E Los Arboles Dr
- 8748 S Kenwood Ln
- 1964 E Calle Monte Vista
- 1964 E Calle Monte Vista
- 1965 E Los Arboles Dr
- 1973 E Los Arboles Dr
- 1959 E Calle Monte Vista
- 1959 E Calle Monte Vista
- 8652 S Kenwood Ln
- 8661 S Kenwood Ln