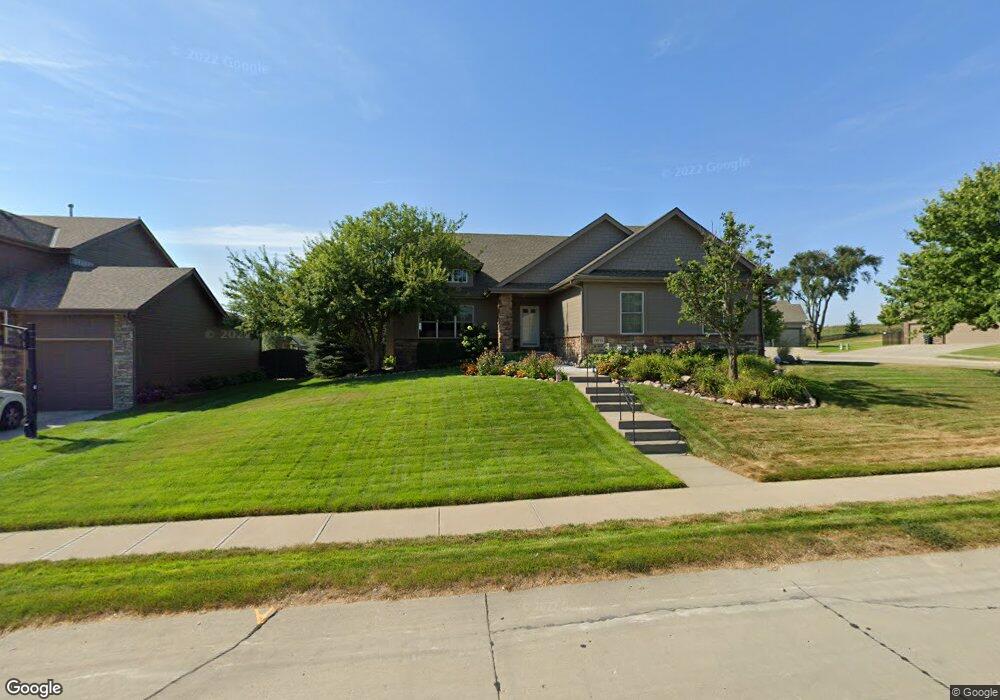
19713 M St Omaha, NE 68135
Southwest Omaha NeighborhoodEstimated Value: $471,769 - $555,000
4
Beds
5
Baths
3,047
Sq Ft
$164/Sq Ft
Est. Value
About This Home
This home is located at 19713 M St, Omaha, NE 68135 and is currently estimated at $500,942, approximately $164 per square foot. 19713 M St is a home located in Douglas County with nearby schools including Reagan Elementary School, Beadle Middle School, and Millard West High School.
Ownership History
Date
Name
Owned For
Owner Type
Purchase Details
Closed on
Apr 30, 2024
Sold by
Fenton Geraldine M
Bought by
Geraldine M Fenton Trust and Fenton
Current Estimated Value
Purchase Details
Closed on
Oct 31, 2006
Sold by
Todd Menard Construction Llc
Bought by
Fenton Jon E
Purchase Details
Closed on
Jun 6, 2006
Sold by
Whitehawk Development Llc
Bought by
Todd Menard Construction Llc
Create a Home Valuation Report for This Property
The Home Valuation Report is an in-depth analysis detailing your home's value as well as a comparison with similar homes in the area
Home Values in the Area
Average Home Value in this Area
Purchase History
| Date | Buyer | Sale Price | Title Company |
|---|---|---|---|
| Geraldine M Fenton Trust | -- | None Listed On Document | |
| Fenton Jon E | $321,700 | -- | |
| Todd Menard Construction Llc | $40,000 | -- |
Source: Public Records
Tax History Compared to Growth
Tax History
| Year | Tax Paid | Tax Assessment Tax Assessment Total Assessment is a certain percentage of the fair market value that is determined by local assessors to be the total taxable value of land and additions on the property. | Land | Improvement |
|---|---|---|---|---|
| 2025 | $9,280 | $426,600 | $43,900 | $382,700 |
| 2024 | $5,042 | $426,600 | $43,900 | $382,700 |
| 2023 | $5,042 | $362,800 | $43,900 | $318,900 |
| 2022 | $9,507 | $362,800 | $43,900 | $318,900 |
| 2021 | $8,721 | $331,600 | $43,900 | $287,700 |
| 2020 | $8,822 | $331,600 | $43,900 | $287,700 |
| 2019 | $8,097 | $305,000 | $55,800 | $249,200 |
| 2018 | $8,204 | $305,000 | $55,800 | $249,200 |
| 2017 | $8,093 | $305,000 | $55,800 | $249,200 |
| 2016 | $7,551 | $282,300 | $40,000 | $242,300 |
| 2015 | $7,529 | $282,300 | $40,000 | $242,300 |
| 2014 | $7,529 | $282,300 | $40,000 | $242,300 |
Source: Public Records
Map
Nearby Homes