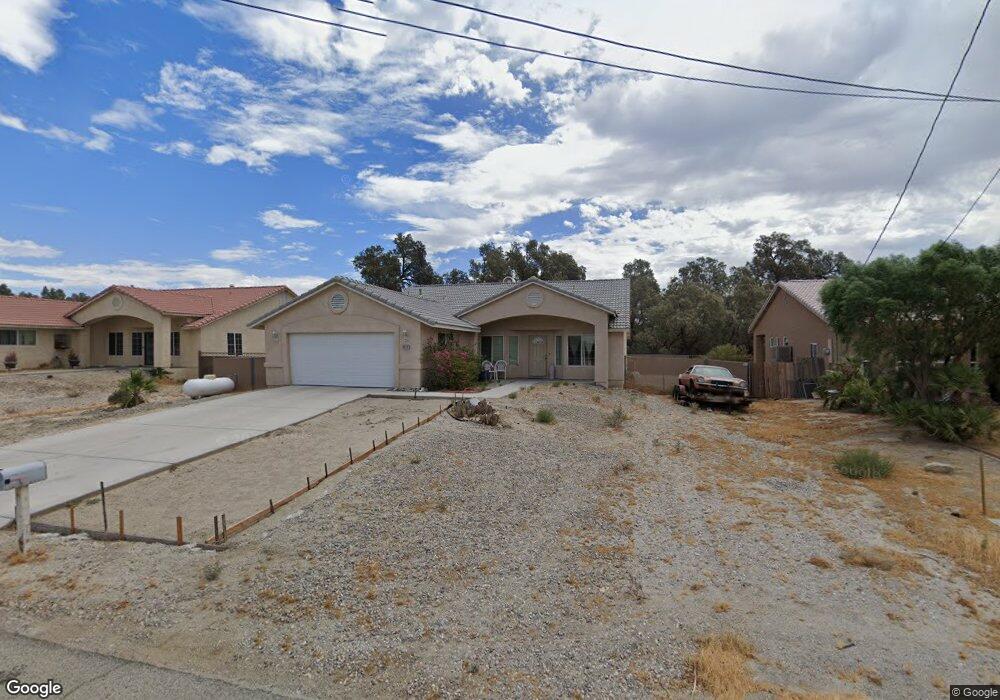
19716 Sagebrush Trail Desert Hot Springs, CA 92241
Estimated Value: $359,000 - $494,144
3
Beds
2
Baths
1,825
Sq Ft
$246/Sq Ft
Est. Value
About This Home
This home is located at 19716 Sagebrush Trail, Desert Hot Springs, CA 92241 and is currently estimated at $449,786, approximately $246 per square foot. 19716 Sagebrush Trail is a home located in Riverside County with nearby schools including Bubbling Wells Elementary School, Desert Springs Middle School, and Desert Hot Springs High School.
Ownership History
Date
Name
Owned For
Owner Type
Purchase Details
Closed on
Jan 29, 2019
Sold by
Seehoffer Joan E
Bought by
Seehoffer Joan E and Blaney Dana Jean
Current Estimated Value
Purchase Details
Closed on
May 20, 2008
Sold by
Jwb Development Inc
Bought by
Seehoffer Joan E
Home Financials for this Owner
Home Financials are based on the most recent Mortgage that was taken out on this home.
Original Mortgage
$157,500
Outstanding Balance
$100,627
Interest Rate
6.05%
Mortgage Type
Purchase Money Mortgage
Estimated Equity
$349,159
Purchase Details
Closed on
Sep 6, 2006
Sold by
Rc Construction Group Inc
Bought by
Jwb Development Inc
Purchase Details
Closed on
Apr 7, 2006
Sold by
Parker Janice
Bought by
Rc Construction Group Inc
Create a Home Valuation Report for This Property
The Home Valuation Report is an in-depth analysis detailing your home's value as well as a comparison with similar homes in the area
Home Values in the Area
Average Home Value in this Area
Purchase History
| Date | Buyer | Sale Price | Title Company |
|---|---|---|---|
| Seehoffer Joan E | -- | None Available | |
| Seehoffer Joan E | $175,000 | Southland Title | |
| Jwb Development Inc | $100,000 | Lawyers Title Company | |
| Rc Construction Group Inc | $75,000 | Southland Title Inland Empir |
Source: Public Records
Mortgage History
| Date | Status | Borrower | Loan Amount |
|---|---|---|---|
| Open | Seehoffer Joan E | $157,500 |
Source: Public Records
Tax History Compared to Growth
Tax History
| Year | Tax Paid | Tax Assessment Tax Assessment Total Assessment is a certain percentage of the fair market value that is determined by local assessors to be the total taxable value of land and additions on the property. | Land | Improvement |
|---|---|---|---|---|
| 2025 | $2,795 | $229,846 | $39,392 | $190,454 |
| 2023 | $2,795 | $220,922 | $37,863 | $183,059 |
| 2022 | $2,772 | $216,591 | $37,121 | $179,470 |
| 2021 | $2,713 | $212,345 | $36,394 | $175,951 |
| 2020 | $2,569 | $210,168 | $36,021 | $174,147 |
| 2019 | $2,522 | $206,048 | $35,316 | $170,732 |
| 2018 | $2,472 | $202,009 | $34,624 | $167,385 |
| 2017 | $2,431 | $198,049 | $33,946 | $164,103 |
| 2016 | $2,357 | $194,167 | $33,281 | $160,886 |
| 2015 | $2,266 | $191,252 | $32,782 | $158,470 |
| 2014 | $1,775 | $149,000 | $26,000 | $123,000 |
Source: Public Records
Map
Nearby Homes
- 67588 Cactus Apple Dr
- 19389 Prickly Pear Trail
- 67781 Ocotillo Trail
- 67590 Hatchet Cactus Dr
- 00 Hatchet Cactus Dr
- 67536 Hatchet Cactus Dr
- 19120 Bubbling Wells Rd
- 19673 Cottonwood Rd
- 67780 Club House Dr
- 19187 Cottonwood Dr
- 0 Dr
- 67626 Yaqui Ln
- 0 20th Ave Unit SW25176731
- 67687 Long Canyon Ln
- 0 Yaqui Ln
- 67709 Long Canyon Ln
- 67686 Long Canyon Ln
- 0 Buckboard Ln Unit 219133310DA
- 67670 Buckboard Ln
- 67645 Broken Arrow Ln
- 19750 Sagebrush Trail
- 19686 Sagebrush Trail
- 19715 Prickly Pear Trail
- 0 Prickly Pear
- 19689 Sagebrush Trail
- 19651 Prickly Pear Trail
- 67606 Cactus Apple Dr
- 19584 Sagebrush Trail
- 19591 Prickly Pear Trail
- 1 Prickly Pear Trail
- 0 Cactus Apple Dr Unit 215011398
- 0 Cactus Apple Dr Unit 216030498
- 0 Cactus Apple Dr
- 19716 Prickly Pear Trail
- 19782 Prickly Pear Trail
- 19526 Sagebrush Trail
- 19539 Sagebrush Trail
- 19584 Prickly Pear Trail
- 19521 Prickly Pear Trail
- 0 Sagebrush Unit 219010257DA