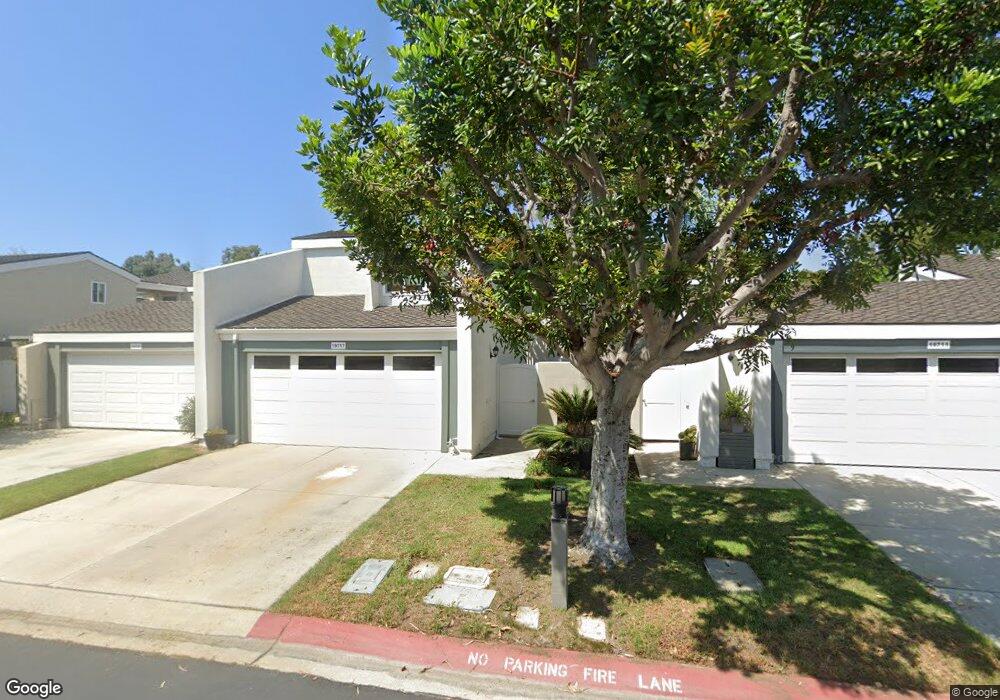
19721 Seashore Cir Huntington Beach, CA 92648
Downtown Huntington Beach NeighborhoodEstimated Value: $1,479,000 - $1,557,216
4
Beds
3
Baths
2,260
Sq Ft
$669/Sq Ft
Est. Value
About This Home
This home is located at 19721 Seashore Cir, Huntington Beach, CA 92648 and is currently estimated at $1,512,054, approximately $669 per square foot. 19721 Seashore Cir is a home located in Orange County with nearby schools including Agnes L. Smith Elementary, Ethel Dwyer Middle, and Huntington Beach High School.
Ownership History
Date
Name
Owned For
Owner Type
Purchase Details
Closed on
May 21, 2024
Sold by
Ronald H Wood And Judith A Wood 1997 Tru and Judith A Wood Separate Property Revocabl
Bought by
Quiet Bay Lane Investments Llc
Current Estimated Value
Purchase Details
Closed on
Jan 28, 2021
Sold by
Wood Judith A and Wood Ronald
Bought by
Gam Deborah and Cawhorn Tricia
Purchase Details
Closed on
Jan 25, 2021
Sold by
Judith Wood Family Investments Llc
Bought by
Wood Judith A and Wood Ronald
Purchase Details
Closed on
Nov 30, 2011
Sold by
Wood Judith A
Bought by
Judith Wood Family Investments Llc
Purchase Details
Closed on
Apr 13, 2011
Sold by
Wood Judith A
Bought by
Wood Judith A and Judith A Wood Separate Property Revocabl
Purchase Details
Closed on
Jun 5, 1997
Sold by
Wood Ronald H and Wood Judy A
Bought by
Wood Ronald H and Wood Judith A
Create a Home Valuation Report for This Property
The Home Valuation Report is an in-depth analysis detailing your home's value as well as a comparison with similar homes in the area
Home Values in the Area
Average Home Value in this Area
Purchase History
| Date | Buyer | Sale Price | Title Company |
|---|---|---|---|
| Quiet Bay Lane Investments Llc | -- | None Listed On Document | |
| Deborah A Gam Separate Property Trust | -- | None Listed On Document | |
| Gam Deborah | -- | None Available | |
| Wood Judith A | -- | None Available | |
| Judith Wood Family Investments Llc | -- | None Available | |
| Wood Judith A | -- | None Available | |
| Wood Judith A | -- | None Available | |
| Wood Ronald H | -- | -- |
Source: Public Records
Tax History Compared to Growth
Tax History
| Year | Tax Paid | Tax Assessment Tax Assessment Total Assessment is a certain percentage of the fair market value that is determined by local assessors to be the total taxable value of land and additions on the property. | Land | Improvement |
|---|---|---|---|---|
| 2025 | $4,522 | $382,079 | $207,545 | $174,534 |
| 2024 | $4,522 | $374,588 | $203,476 | $171,112 |
| 2023 | $4,419 | $367,244 | $199,487 | $167,757 |
| 2022 | $4,303 | $360,044 | $195,576 | $164,468 |
| 2021 | $4,224 | $352,985 | $191,741 | $161,244 |
| 2020 | $4,196 | $349,366 | $189,775 | $159,591 |
| 2019 | $4,148 | $342,516 | $186,054 | $156,462 |
| 2018 | $4,085 | $335,800 | $182,405 | $153,395 |
| 2017 | $4,031 | $329,216 | $178,828 | $150,388 |
| 2016 | $3,858 | $322,761 | $175,321 | $147,440 |
| 2015 | $3,820 | $317,913 | $172,687 | $145,226 |
| 2014 | $3,740 | $311,686 | $169,304 | $142,382 |
Source: Public Records
Map
Nearby Homes
- 19717 Seashore Cir
- 19711 Seashore Cir
- 19727 Seashore Cir
- 19707 Seashore Cir
- 19731 Seashore Cir
- 19718 Seashore Cir
- 19722 Seashore Cir
- 19728 Seashore Cir
- 19734 Seashore Cir
- 19731 Little Harbor Dr
- 19715 Little Harbor Dr
- 19732 Seashore Cir
- 7308 Waterside Dr
- 7302 Waterside Dr
- 7312 Waterside Dr
- 19735 Little Harbor Dr
- 7292 Waterside Dr
- 7318 Waterside Dr
- 19702 Stern Ln
- 19711 Little Harbor Dr