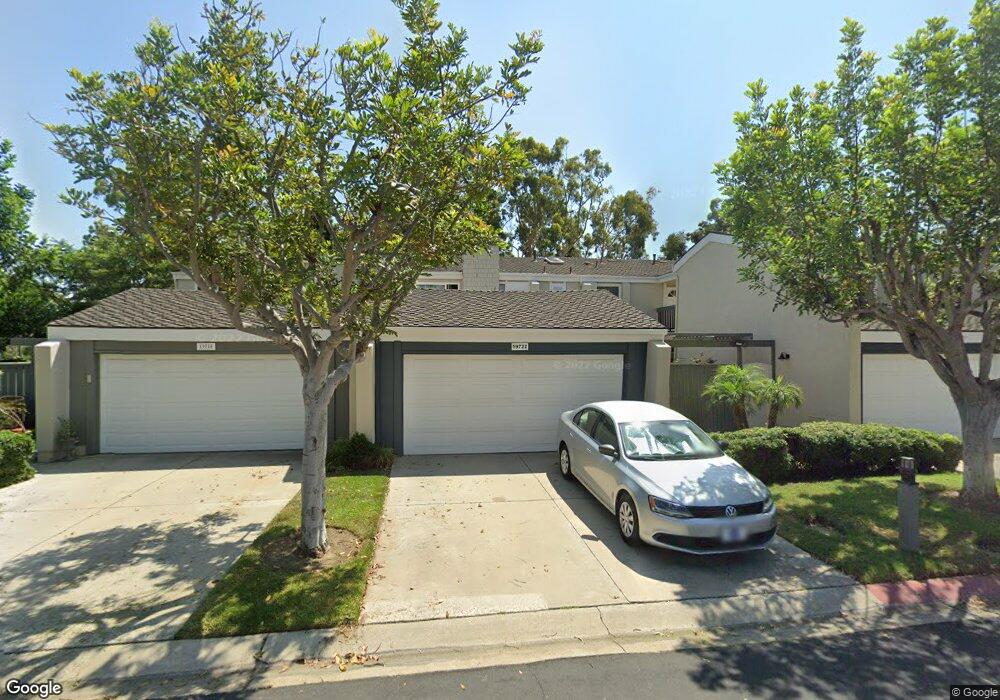
19722 Seashore Cir Huntington Beach, CA 92648
Downtown Huntington Beach NeighborhoodEstimated Value: $1,340,000 - $1,414,366
3
Beds
3
Baths
1,728
Sq Ft
$795/Sq Ft
Est. Value
About This Home
This home is located at 19722 Seashore Cir, Huntington Beach, CA 92648 and is currently estimated at $1,374,342, approximately $795 per square foot. 19722 Seashore Cir is a home located in Orange County with nearby schools including Agnes L. Smith Elementary, Ethel Dwyer Middle, and Huntington Beach High School.
Ownership History
Date
Name
Owned For
Owner Type
Purchase Details
Closed on
Oct 6, 2009
Sold by
David Erlinda R
Bought by
David Erlinda R and Erlinda R David Living Trust
Current Estimated Value
Purchase Details
Closed on
Aug 17, 2005
Sold by
Farzad Melissa M
Bought by
Farzad B Robert
Home Financials for this Owner
Home Financials are based on the most recent Mortgage that was taken out on this home.
Original Mortgage
$345,000
Interest Rate
5.7%
Mortgage Type
New Conventional
Purchase Details
Closed on
Jul 12, 2005
Sold by
Farzad B Robert
Bought by
David Erlinda R
Home Financials for this Owner
Home Financials are based on the most recent Mortgage that was taken out on this home.
Original Mortgage
$345,000
Interest Rate
5.7%
Mortgage Type
New Conventional
Purchase Details
Closed on
Mar 8, 2000
Sold by
Musicant Alan Daniel and Musicant Mark Harris
Bought by
Farzad B Robert
Home Financials for this Owner
Home Financials are based on the most recent Mortgage that was taken out on this home.
Original Mortgage
$230,250
Interest Rate
8.38%
Create a Home Valuation Report for This Property
The Home Valuation Report is an in-depth analysis detailing your home's value as well as a comparison with similar homes in the area
Home Values in the Area
Average Home Value in this Area
Purchase History
| Date | Buyer | Sale Price | Title Company |
|---|---|---|---|
| David Erlinda R | -- | None Available | |
| Farzad B Robert | -- | Landwood Title | |
| David Erlinda R | $675,000 | Landwood Title | |
| Farzad B Robert | $307,000 | Benefit Land Title Company |
Source: Public Records
Mortgage History
| Date | Status | Borrower | Loan Amount |
|---|---|---|---|
| Previous Owner | David Erlinda R | $345,000 | |
| Previous Owner | Farzad B Robert | $230,250 | |
| Closed | Farzad B Robert | $46,050 |
Source: Public Records
Tax History Compared to Growth
Tax History
| Year | Tax Paid | Tax Assessment Tax Assessment Total Assessment is a certain percentage of the fair market value that is determined by local assessors to be the total taxable value of land and additions on the property. | Land | Improvement |
|---|---|---|---|---|
| 2025 | $7,014 | $619,763 | $264,560 | $355,203 |
| 2024 | $7,014 | $607,611 | $259,372 | $348,239 |
| 2023 | $6,855 | $595,698 | $254,287 | $341,411 |
| 2022 | $6,674 | $584,018 | $249,301 | $334,717 |
| 2021 | $6,549 | $572,567 | $244,413 | $328,154 |
| 2020 | $6,506 | $566,697 | $241,907 | $324,790 |
| 2019 | $6,428 | $555,586 | $237,164 | $318,422 |
| 2018 | $6,328 | $544,693 | $232,514 | $312,179 |
| 2017 | $6,243 | $534,013 | $227,955 | $306,058 |
| 2016 | $5,967 | $523,543 | $223,486 | $300,057 |
| 2015 | $5,908 | $515,679 | $220,129 | $295,550 |
| 2014 | $5,784 | $505,578 | $215,817 | $289,761 |
Source: Public Records
Map
Nearby Homes
- 19728 Seashore Cir
- 19718 Seashore Cir
- 19732 Seashore Cir
- 19734 Seashore Cir
- 19721 Seashore Cir
- 19727 Seashore Cir
- 19717 Seashore Cir
- 19731 Seashore Cir
- 19711 Seashore Cir
- 19707 Seashore Cir
- 19772 Waterview Ln
- 7328 Waterside Dr
- 7322 Waterside Dr
- 7318 Waterside Dr
- 7312 Waterside Dr
- 19776 Waterview Ln
- 19771 Waterview Ln
- 7308 Waterside Dr
- 19782 Waterview Ln
- 7331 Veering Cir