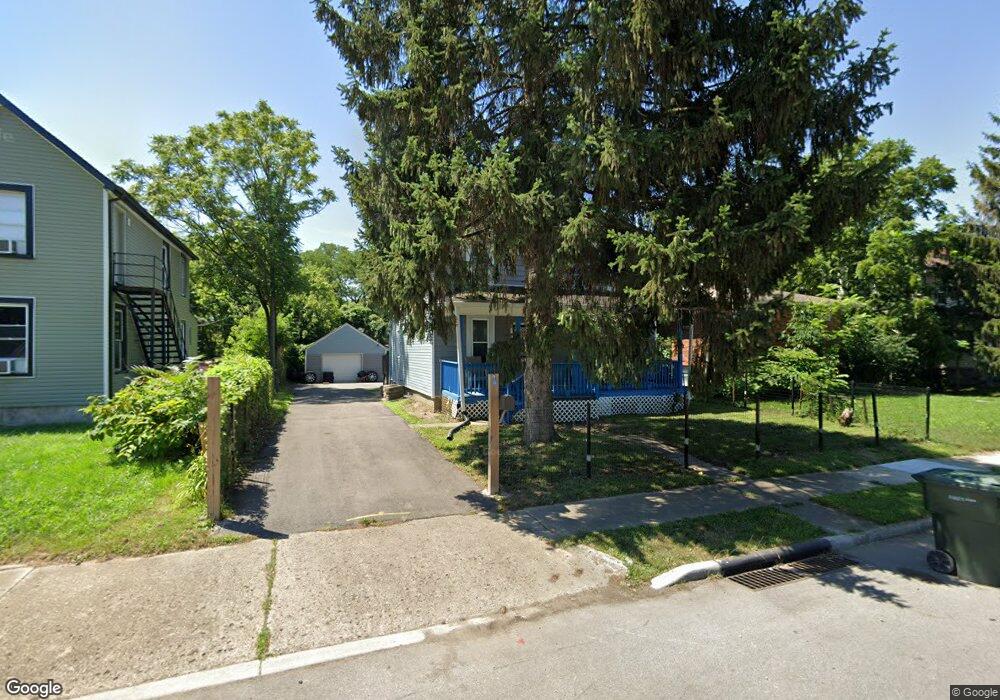
1973 E Denune Columbus, OH 43211
East Linden NeighborhoodEstimated Value: $193,000 - $225,000
4
Beds
2
Baths
1,736
Sq Ft
$120/Sq Ft
Est. Value
About This Home
This home is located at 1973 E Denune, Columbus, OH 43211 and is currently estimated at $208,055, approximately $119 per square foot. 1973 E Denune is a home located in Franklin County with nearby schools including Linden STEM Academy (K-6), Linden-Mckinley Stem School On Arcadia, and Focus Learning Academy of Central Columbus.
Ownership History
Date
Name
Owned For
Owner Type
Purchase Details
Closed on
Jan 10, 2020
Sold by
Bison Management Services Llc
Bought by
Lopez Jose C and Pineda Erika L
Current Estimated Value
Purchase Details
Closed on
Mar 10, 2014
Sold by
G & Sg Investment Llc
Bought by
Levitskiy Sergey and Levitskiy Grigoriy
Home Financials for this Owner
Home Financials are based on the most recent Mortgage that was taken out on this home.
Original Mortgage
$59,640
Interest Rate
3.67%
Mortgage Type
New Conventional
Purchase Details
Closed on
Sep 19, 2012
Sold by
Levitskiy Sergei and Levitskiy Grigoriy
Bought by
G & Sg Investment Llc
Purchase Details
Closed on
Apr 26, 2006
Sold by
Zinn Mike G and Jp Morgan Chase Bank Na
Bought by
Levitskiy Sergei and Levitskiy Grigoriy
Purchase Details
Closed on
Nov 15, 1999
Sold by
Alaska Seaboard Partners Lp
Bought by
Zinn Mike G
Home Financials for this Owner
Home Financials are based on the most recent Mortgage that was taken out on this home.
Original Mortgage
$20,000
Interest Rate
7.97%
Purchase Details
Closed on
Aug 6, 1999
Sold by
Pinson Ozzie V and Bogs Llc
Bought by
Alaska Seaboard Partners Lp
Purchase Details
Closed on
Jul 26, 1977
Bought by
Pinson Ozzie
Create a Home Valuation Report for This Property
The Home Valuation Report is an in-depth analysis detailing your home's value as well as a comparison with similar homes in the area
Home Values in the Area
Average Home Value in this Area
Purchase History
| Date | Buyer | Sale Price | Title Company |
|---|---|---|---|
| Lopez Jose C | $42,500 | Chase Title | |
| Levitskiy Sergey | -- | Servicelink | |
| G & Sg Investment Llc | -- | None Available | |
| Levitskiy Sergei | $30,100 | None Available | |
| Zinn Mike G | $27,000 | Esquire Title | |
| Alaska Seaboard Partners Lp | $25,000 | -- | |
| Pinson Ozzie | -- | -- |
Source: Public Records
Mortgage History
| Date | Status | Borrower | Loan Amount |
|---|---|---|---|
| Previous Owner | Levitskiy Sergey | $59,640 | |
| Previous Owner | Zinn Mike G | $20,000 |
Source: Public Records
Tax History
| Year | Tax Paid | Tax Assessment Tax Assessment Total Assessment is a certain percentage of the fair market value that is determined by local assessors to be the total taxable value of land and additions on the property. | Land | Improvement |
|---|---|---|---|---|
| 2025 | $3,027 | $67,450 | $9,170 | $58,280 |
| 2024 | $3,027 | $67,450 | $9,170 | $58,280 |
| 2023 | $2,988 | $67,445 | $9,170 | $58,275 |
| 2022 | $1,464 | $28,220 | $2,070 | $26,150 |
| 2021 | $1,019 | $19,610 | $2,070 | $17,540 |
| 2020 | $1,084 | $19,610 | $2,070 | $17,540 |
| 2019 | $1,433 | $19,610 | $2,070 | $17,540 |
| 2018 | $922 | $14,010 | $2,070 | $11,940 |
| 2017 | $1,404 | $18,140 | $2,070 | $16,070 |
| 2016 | $500 | $7,360 | $2,700 | $4,660 |
| 2015 | $974 | $14,920 | $2,700 | $12,220 |
| 2014 | $925 | $14,920 | $2,700 | $12,220 |
| 2013 | $748 | $17,500 | $3,150 | $14,350 |
Source: Public Records
Map
Nearby Homes
- 1884 Aberdeen Ave
- 2475 Parkwood Ave
- 1827 Aberdeen Ave
- 1326 Minnesota Ave
- 2765 Joyce Ave
- 1938 Myrtle Ave
- 2735 Berrell Ave
- 2055 Earl Ave
- 2823 Fern Ave
- 0 Aberdeen Ave Unit 226000728
- 0 Aberdeen Ave Unit 226002456
- 0 Aberdeen Ave Unit 226002459
- 0 Aberdeen Ave Unit 226002457
- 0 Aberdeen Ave Unit 226002458
- 1877 Robert St
- 1799 Harold Place
- 2291 Taylor Ave
- 1691 E Weber Rd
- 2068 Agler Rd
- 2699 Woodland Ave
- 1973 Denune Ave
- 1967 Denune Ave
- 1975 Denune Ave
- 1961 Denune Ave
- 1953 Denune Ave
- 1964 Aberdeen Ave
- 1968 Aberdeen Ave
- 1974 Aberdeen Ave
- 1999 Denune Ave Unit 16
- 1947 Denune Ave
- 1952 Aberdeen Ave
- 1980 Aberdeen Ave
- 1986 Aberdeen Ave
- 1942 Aberdeen Ave
- 2007 Denune Ave
- 1994 Aberdeen Ave
- 1960 Denune Ave
- 1968 Denune Ave
- 1935 Denune Ave
- 1950 Denune Ave
Your Personal Tour Guide
Ask me questions while you tour the home.