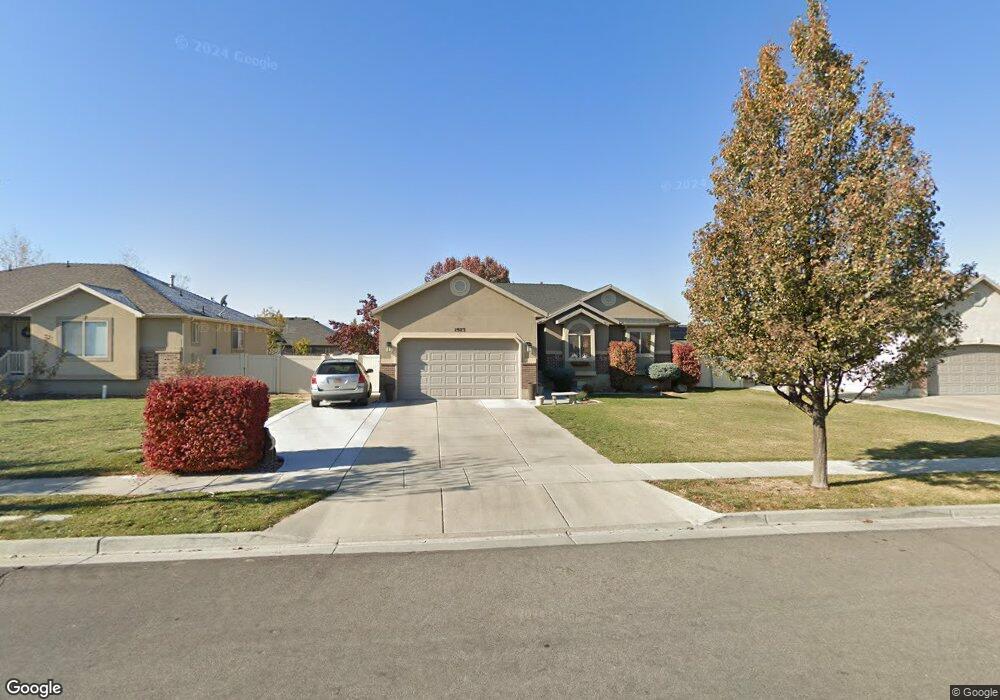
1973 N 2645 W Clearfield, UT 84015
Estimated Value: $499,000 - $557,000
3
Beds
2
Baths
2,800
Sq Ft
$189/Sq Ft
Est. Value
About This Home
This home is located at 1973 N 2645 W, Clearfield, UT 84015 and is currently estimated at $528,436, approximately $188 per square foot. 1973 N 2645 W is a home located in Davis County with nearby schools including West Clinton Elementary School, West Point Junior High School, and Clearfield High School.
Ownership History
Date
Name
Owned For
Owner Type
Purchase Details
Closed on
Apr 27, 2006
Sold by
Buttars Chad G
Bought by
Moon Stephen Keith and Moon Kylie S
Current Estimated Value
Home Financials for this Owner
Home Financials are based on the most recent Mortgage that was taken out on this home.
Original Mortgage
$181,700
Outstanding Balance
$103,994
Interest Rate
6.29%
Mortgage Type
Fannie Mae Freddie Mac
Estimated Equity
$424,442
Purchase Details
Closed on
May 19, 2005
Sold by
Hamblin Investments Inc
Bought by
M & D Developers Llc
Purchase Details
Closed on
May 18, 2005
Sold by
M & D Developers Llc
Bought by
Buttars Chad G
Create a Home Valuation Report for This Property
The Home Valuation Report is an in-depth analysis detailing your home's value as well as a comparison with similar homes in the area
Home Values in the Area
Average Home Value in this Area
Purchase History
| Date | Buyer | Sale Price | Title Company |
|---|---|---|---|
| Moon Stephen Keith | -- | Heritage West Title Ins Agen | |
| M & D Developers Llc | -- | Heritage West Title Ins Agen | |
| Buttars Chad G | -- | -- |
Source: Public Records
Mortgage History
| Date | Status | Borrower | Loan Amount |
|---|---|---|---|
| Open | Moon Stephen Keith | $181,700 |
Source: Public Records
Tax History Compared to Growth
Tax History
| Year | Tax Paid | Tax Assessment Tax Assessment Total Assessment is a certain percentage of the fair market value that is determined by local assessors to be the total taxable value of land and additions on the property. | Land | Improvement |
|---|---|---|---|---|
| 2025 | $2,728 | $262,350 | $85,155 | $177,195 |
| 2024 | $2,612 | $252,450 | $94,124 | $158,326 |
| 2023 | $2,494 | $446,000 | $106,177 | $339,823 |
| 2022 | $2,657 | $262,901 | $66,072 | $196,829 |
| 2021 | $2,412 | $354,000 | $80,820 | $273,180 |
| 2020 | $2,100 | $305,000 | $67,689 | $237,311 |
| 2019 | $2,100 | $298,000 | $80,934 | $217,066 |
| 2018 | $1,973 | $275,000 | $68,602 | $206,398 |
| 2016 | $1,719 | $123,750 | $25,587 | $98,163 |
| 2015 | $1,799 | $123,145 | $25,587 | $97,558 |
| 2014 | $1,748 | $121,538 | $25,587 | $95,951 |
| 2013 | -- | $113,399 | $24,320 | $89,079 |
Source: Public Records
Map
Nearby Homes
- 2617 N 2080 W Unit 176
- Harvard Plan at Summerfield - Enclave
- 2208 W 2615 N
- Linden Plan at Summerfield - Vista
- Yale Plan at Summerfield - Enclave
- Gambel Oak Plan at Summerfield - Vista
- Cedar Plan at Summerfield - Vista
- Elm Plan at Summerfield - Vista
- Princeton Plan at Summerfield - Enclave
- Cambridge Plan at Summerfield - Enclave
- Cornell Plan at Summerfield - Enclave
- Sycamore Plan at Summerfield - Vista
- Berkeley Plan at Summerfield - Enclave
- Birch Plan at Summerfield - Vista
- Stanford Plan at Summerfield - Enclave
- 2219 N 2475 W
- 1648 N 2615 W
- 3941 W 1800 N
- 2434 W 2250 N
- 2322 N 2500 W