1973 Rosewood Dr Ontario, OH 44906
Estimated Value: $136,000 - $174,642
3
Beds
2
Baths
1,050
Sq Ft
$147/Sq Ft
Est. Value
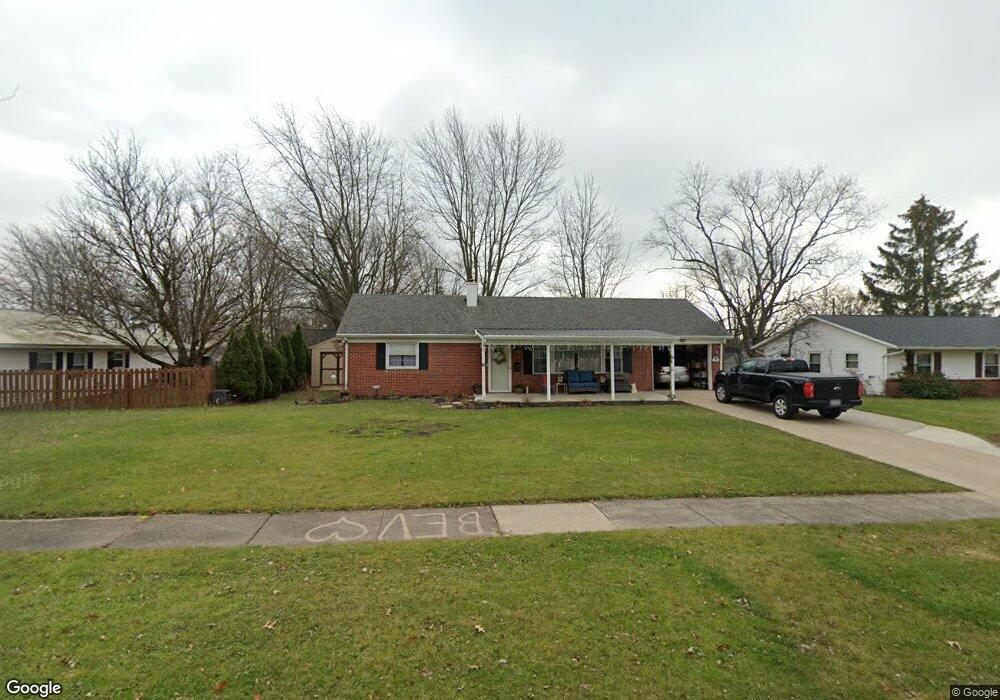
About This Home
This home is located at 1973 Rosewood Dr, Ontario, OH 44906 and is currently estimated at $154,411, approximately $147 per square foot. 1973 Rosewood Dr is a home located in Richland County with nearby schools including Stingel Elementary School, Ontario Middle School, and Ontario High School.
Ownership History
Date
Name
Owned For
Owner Type
Purchase Details
Closed on
Sep 3, 2019
Sold by
Mckean Rosemary and Mckean Rose M
Bought by
Wehr Beverly G
Current Estimated Value
Home Financials for this Owner
Home Financials are based on the most recent Mortgage that was taken out on this home.
Original Mortgage
$69,200
Outstanding Balance
$58,284
Interest Rate
3.7%
Mortgage Type
Future Advance Clause Open End Mortgage
Estimated Equity
$96,127
Purchase Details
Closed on
Nov 7, 2003
Sold by
Stinehelfer Judith
Bought by
Mckean Leland and Mckean Rosemary
Purchase Details
Closed on
Dec 11, 2002
Sold by
Just Biz Inc
Bought by
Stinehelfer Judith
Home Financials for this Owner
Home Financials are based on the most recent Mortgage that was taken out on this home.
Original Mortgage
$71,200
Interest Rate
5.59%
Mortgage Type
New Conventional
Purchase Details
Closed on
Dec 26, 2000
Sold by
Mirol Irma C
Bought by
Just Biz Inc
Create a Home Valuation Report for This Property
The Home Valuation Report is an in-depth analysis detailing your home's value as well as a comparison with similar homes in the area
Home Values in the Area
Average Home Value in this Area
Purchase History
| Date | Buyer | Sale Price | Title Company |
|---|---|---|---|
| Wehr Beverly G | $86,500 | Chicago Title | |
| Mckean Leland | $95,500 | -- | |
| Stinehelfer Judith | $89,000 | -- | |
| Just Biz Inc | $47,000 | -- |
Source: Public Records
Mortgage History
| Date | Status | Borrower | Loan Amount |
|---|---|---|---|
| Open | Wehr Beverly G | $69,200 | |
| Previous Owner | Stinehelfer Judith | $71,200 |
Source: Public Records
Tax History Compared to Growth
Tax History
| Year | Tax Paid | Tax Assessment Tax Assessment Total Assessment is a certain percentage of the fair market value that is determined by local assessors to be the total taxable value of land and additions on the property. | Land | Improvement |
|---|---|---|---|---|
| 2024 | $2,417 | $48,500 | $11,900 | $36,600 |
| 2023 | $2,417 | $48,500 | $11,900 | $36,600 |
| 2022 | $1,773 | $30,610 | $8,400 | $22,210 |
| 2021 | $1,776 | $30,610 | $8,400 | $22,210 |
| 2020 | $1,830 | $29,550 | $8,400 | $21,150 |
| 2019 | $1,115 | $25,040 | $7,120 | $17,920 |
| 2018 | $946 | $25,040 | $7,120 | $17,920 |
| 2017 | $931 | $25,040 | $7,120 | $17,920 |
| 2016 | $934 | $24,990 | $6,760 | $18,230 |
| 2015 | $933 | $24,990 | $6,760 | $18,230 |
| 2014 | $935 | $24,990 | $6,760 | $18,230 |
| 2012 | $425 | $24,990 | $7,120 | $17,870 |
Source: Public Records
Map
Nearby Homes
- 1947 Teakwood Dr
- 2007 Teakwood Dr
- 2010 Teakwood Dr
- 1915 Teakwood Dr Unit 1915
- 1909 Teakwood Dr
- 720 Lindaire Ln E
- 648 Villa Dr Unit 648
- 655 Villa Dr
- 700 Villa Dr
- 2270 Ferguson Rd
- 1980 Walker Lake Rd
- 1496 W 4th St
- 1996 Park Ave W
- 2585 Deerfield Ln
- 0 Spring Village Ln
- 1396 Spring Village Dr Unit 1398
- Lot 2 Spring Village Ln
- 1431 Silver Ln
- 1598-1600 Spring Village Ln
- 1592 Walker Woods Blvd
- 1979 Rosewood Dr
- 479 Willowood Dr E
- 465 Willowood Dr E
- 453 Willowood Dr E
- 1987 Rosewood Dr
- 1980 Rosewood Dr
- 443 Willowood Dr E
- 1980 Rosewood Dr
- 1964 Rosewood Dr
- 1986 Rosewood Dr
- 484 Willowood Dr E
- 1956 Tanglewood Dr S
- 1994 Rosewood Dr
- 1995 Rosewood Dr
- 405 Sherwood Ct
- 466 Willowood Dr E
- 470 Willowood Dr E
- 460 Willowood Dr E
- 476 Willowood Dr E
- 1938 Rosewood Dr