Estimated Value: $383,078 - $441,000
3
Beds
3
Baths
2,394
Sq Ft
$178/Sq Ft
Est. Value
About This Home
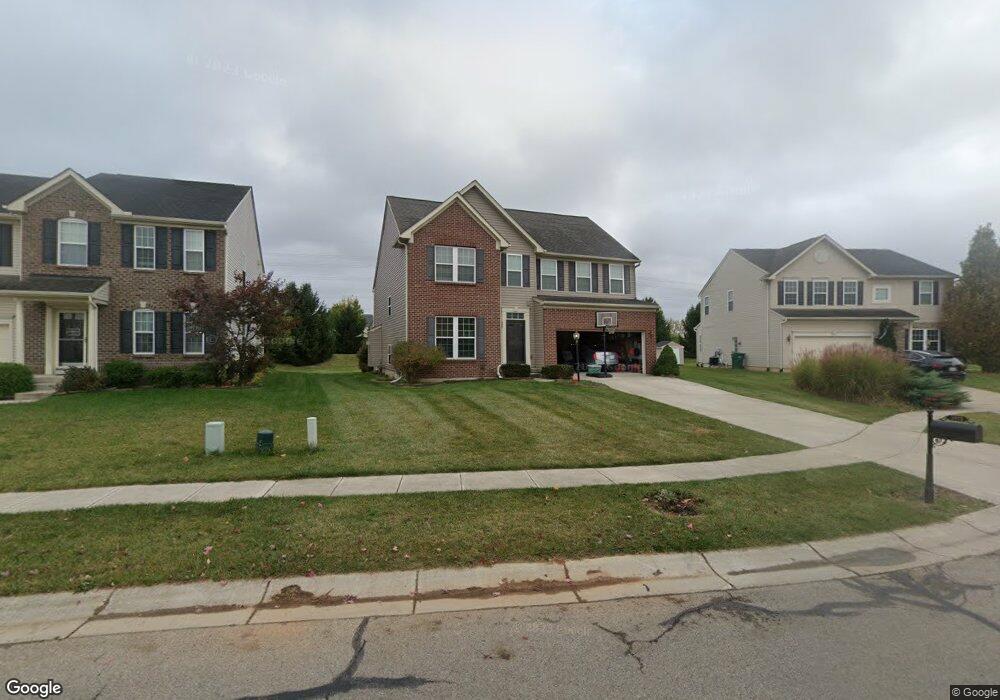
This home is located at 1973 Spring Ridge Dr, Xenia, OH 45385 and is currently estimated at $425,770, approximately $177 per square foot. 1973 Spring Ridge Dr is a home located in Greene County with nearby schools including Trebein Elementary School, Jacob Coy Middle School, and Beavercreek High School.
Ownership History
Date
Name
Owned For
Owner Type
Purchase Details
Closed on
Feb 16, 2022
Sold by
Yadak Amal
Bought by
Yadak Marwan A
Current Estimated Value
Home Financials for this Owner
Home Financials are based on the most recent Mortgage that was taken out on this home.
Original Mortgage
$126,600
Outstanding Balance
$98,447
Interest Rate
3.15%
Mortgage Type
New Conventional
Estimated Equity
$327,323
Purchase Details
Closed on
Sep 29, 2010
Sold by
Nvr Inc
Bought by
Yadak Marwan A and Yadak Amal
Home Financials for this Owner
Home Financials are based on the most recent Mortgage that was taken out on this home.
Original Mortgage
$126,435
Interest Rate
4.26%
Mortgage Type
New Conventional
Purchase Details
Closed on
Jul 8, 2010
Sold by
Oberer Land Developers Ltd
Bought by
Nvr Inc
Purchase Details
Closed on
Jun 11, 2010
Sold by
Oberer Land Developers Ltd
Bought by
Nvr Inc
Create a Home Valuation Report for This Property
The Home Valuation Report is an in-depth analysis detailing your home's value as well as a comparison with similar homes in the area
Home Values in the Area
Average Home Value in this Area
Purchase History
| Date | Buyer | Sale Price | Title Company |
|---|---|---|---|
| Yadak Marwan A | $17,000 | Mantica Christopher J | |
| Yadak Marwan A | $251,500 | None Available | |
| Nvr Inc | $47,900 | None Available | |
| Nvr Inc | $68,100 | None Available |
Source: Public Records
Mortgage History
| Date | Status | Borrower | Loan Amount |
|---|---|---|---|
| Open | Yadak Marwan A | $126,600 | |
| Previous Owner | Yadak Marwan A | $126,435 |
Source: Public Records
Tax History
| Year | Tax Paid | Tax Assessment Tax Assessment Total Assessment is a certain percentage of the fair market value that is determined by local assessors to be the total taxable value of land and additions on the property. | Land | Improvement |
|---|---|---|---|---|
| 2025 | $6,980 | $117,040 | $24,640 | $92,400 |
| 2024 | $6,980 | $117,040 | $24,640 | $92,400 |
| 2023 | $6,905 | $117,040 | $24,640 | $92,400 |
| 2022 | $6,471 | $97,750 | $20,530 | $77,220 |
| 2021 | $6,541 | $97,750 | $20,530 | $77,220 |
| 2020 | $6,579 | $97,750 | $20,530 | $77,220 |
| 2019 | $6,265 | $84,060 | $10,850 | $73,210 |
| 2018 | $5,425 | $84,060 | $10,850 | $73,210 |
| 2017 | $5,264 | $84,060 | $10,850 | $73,210 |
| 2016 | $5,196 | $77,140 | $10,850 | $66,290 |
| 2015 | $5,234 | $77,140 | $10,850 | $66,290 |
| 2014 | $4,832 | $72,430 | $10,850 | $61,580 |
Source: Public Records
Map
Nearby Homes
- 1788 Fawnwood Ct
- 1105 Windsong Trail
- 2549 Fawn Dr
- 1840 Spring Ridge Ct
- 1121 Whitetail Dr
- 1200 Whitetail Dr
- 506 Glenhaven Way Unit 756-204
- 502 Glenhaven Way Unit 756-202
- 501 Greendell Bend Unit 757-305
- 485 Greendell Bend Unit 757-202
- 487 Greendell Bend Unit 757-203
- 474 Glenhaven Way Unit 755-303
- 470 Glenhaven Way Unit 755-301
- 2657 Verdant Ln Unit 759-304
- 2655 Verdant Ln Unit 759-303
- 2659 Verdant Ln Unit 759-305
- 2651 Verdant Ln Unit 759-203
- 2653 Verdant Ln Unit 759-204
- 2450 Beaver Valley Rd
- 2572 Golden Leaf
- 1965 Spring Ridge Dr
- 1979 Spring Ridge Dr
- 1959 Spring Ridge Dr
- 1968 Spring Ridge Dr
- 1981 Spring Ridge Dr
- 1951 Spring Ridge Dr
- 1983 Spring Ridge Dr
- 1978 Spring Ridge Dr
- 1958 Spring Ridge Dr
- 1943 Spring Ridge Dr
- 1985 Spring Ridge Dr
- 1950 Spring Ridge Dr
- 1983 Daffodil Dr
- 1972 Red Robin Dr N
- 1987 Spring Ridge Dr
- 1962 Red Robin Dr N
- 1982 N Red Robin Dr
- 1982 Red Robin Dr N
- 1937 Spring Ridge Dr
- 1944 Spring Ridge Dr
Your Personal Tour Guide
Ask me questions while you tour the home.