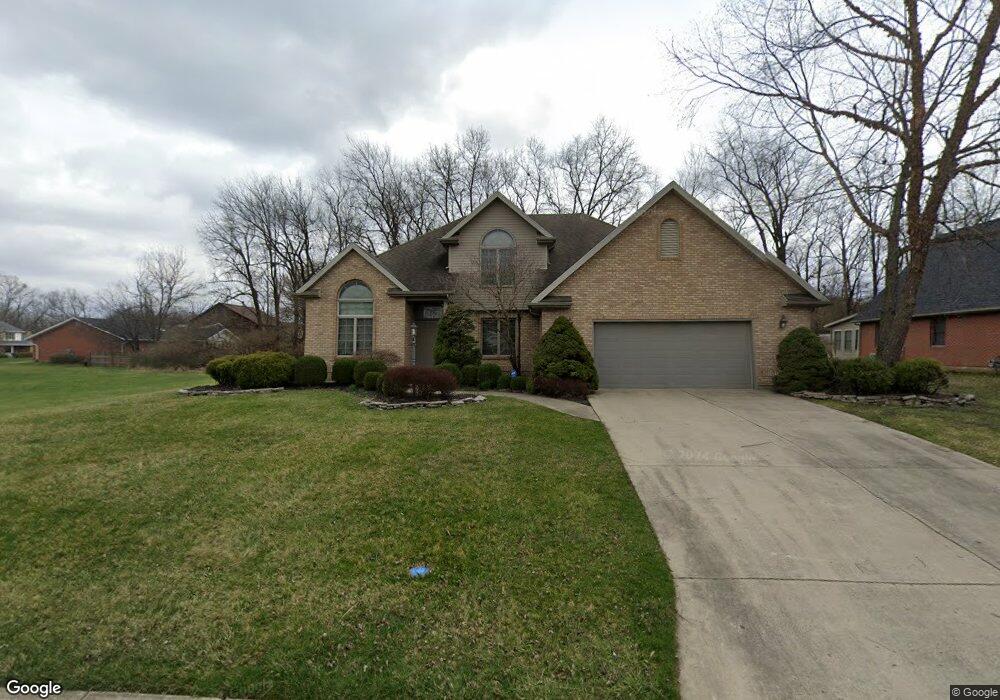
1974 Appian Way Springfield, OH 45503
Estimated Value: $374,000 - $457,000
4
Beds
4
Baths
3,031
Sq Ft
$137/Sq Ft
Est. Value
About This Home
This home is located at 1974 Appian Way, Springfield, OH 45503 and is currently estimated at $414,512, approximately $136 per square foot. 1974 Appian Way is a home located in Clark County with nearby schools including Kenton Elementary School, Roosevelt Middle School, and Springfield High School.
Ownership History
Date
Name
Owned For
Owner Type
Purchase Details
Closed on
Jul 29, 2004
Sold by
Parveen Mohammed and Abker Mohammed
Bought by
Selvarajah Sarojinidevi
Current Estimated Value
Home Financials for this Owner
Home Financials are based on the most recent Mortgage that was taken out on this home.
Original Mortgage
$228,000
Interest Rate
6.1%
Mortgage Type
Purchase Money Mortgage
Purchase Details
Closed on
Feb 22, 2002
Sold by
Parveen Shareefa and Parveen P
Bought by
Mohammed Parveen
Home Financials for this Owner
Home Financials are based on the most recent Mortgage that was taken out on this home.
Original Mortgage
$248,000
Interest Rate
6.92%
Mortgage Type
Purchase Money Mortgage
Purchase Details
Closed on
Jun 5, 1995
Sold by
Varley Cathy E
Bought by
Shareefa Akber and Shareefa Parveen
Home Financials for this Owner
Home Financials are based on the most recent Mortgage that was taken out on this home.
Original Mortgage
$227,250
Interest Rate
7.63%
Mortgage Type
New Conventional
Create a Home Valuation Report for This Property
The Home Valuation Report is an in-depth analysis detailing your home's value as well as a comparison with similar homes in the area
Home Values in the Area
Average Home Value in this Area
Purchase History
| Date | Buyer | Sale Price | Title Company |
|---|---|---|---|
| Selvarajah Sarojinidevi | $285,000 | Landmark Title Agency Inc | |
| Mohammed Parveen | -- | -- | |
| Shareefa Akber | $252,500 | -- |
Source: Public Records
Mortgage History
| Date | Status | Borrower | Loan Amount |
|---|---|---|---|
| Closed | Selvarajah Sarojinidevi | $228,000 | |
| Previous Owner | Mohammed Parveen | $248,000 | |
| Previous Owner | Shareefa Akber | $227,250 |
Source: Public Records
Tax History Compared to Growth
Tax History
| Year | Tax Paid | Tax Assessment Tax Assessment Total Assessment is a certain percentage of the fair market value that is determined by local assessors to be the total taxable value of land and additions on the property. | Land | Improvement |
|---|---|---|---|---|
| 2024 | -- | $109,050 | $22,050 | $87,000 |
| 2023 | $5,255 | $109,050 | $22,050 | $87,000 |
| 2022 | $5,383 | $109,050 | $22,050 | $87,000 |
| 2021 | $5,553 | $103,850 | $21,000 | $82,850 |
| 2020 | $5,565 | $103,850 | $21,000 | $82,850 |
| 2019 | $5,579 | $103,850 | $21,000 | $82,850 |
| 2018 | $5,799 | $103,690 | $21,000 | $82,690 |
| 2017 | $5,795 | $103,691 | $21,000 | $82,691 |
| 2016 | $5,803 | $103,691 | $21,000 | $82,691 |
| 2015 | $5,916 | $103,691 | $21,000 | $82,691 |
| 2014 | $5,891 | $103,691 | $21,000 | $82,691 |
| 2013 | $5,828 | $103,691 | $21,000 | $82,691 |
Source: Public Records
Map
Nearby Homes
- 1535 Winding Trail
- 1639 E Mile Rd
- 2408 Balsam Dr
- 2524 Home Orchard Dr
- 2541 Derr Rd
- 308 Canterbury Dr
- 2516 Balsam Dr
- 1316 Cedarview Dr W
- 414 E 3rd St
- 2683 Home Orchard Dr
- 1710 Mitchell Blvd
- 2540 Rebecca Dr
- 141 S Kensington Place
- 2677 Carousel Dr
- 132 S Kensington Place
- The Siebert Plan at Magnolia Acres
- 1652 N Limestone St
- 2813 Wellsford Dr
- 115 E Home Rd
- 836 E Northern Ave
- 1944 Appian Way
- 1914 Appian Way
- 1121 Apollo Ave
- 1975 Appian Way
- 1129 Apollo Ave
- 1999 Appian Way
- 0 Olympic St Unit 471762
- 0 Olympic St Unit 1021478
- 0 Olympic St Unit 275941
- 0 Olympic St Unit 301667
- 0 Olympic St Unit 301666
- 0 Olympic St Unit 319101
- 0 Olympic St Unit 329536
- 1945 Appian Way
- 2015 Appian Way
- 0 Appian Way
- 1884 Appian Way
- 1201 Apollo Ave
- 1885 Appian Way
- 2101 Olympic St