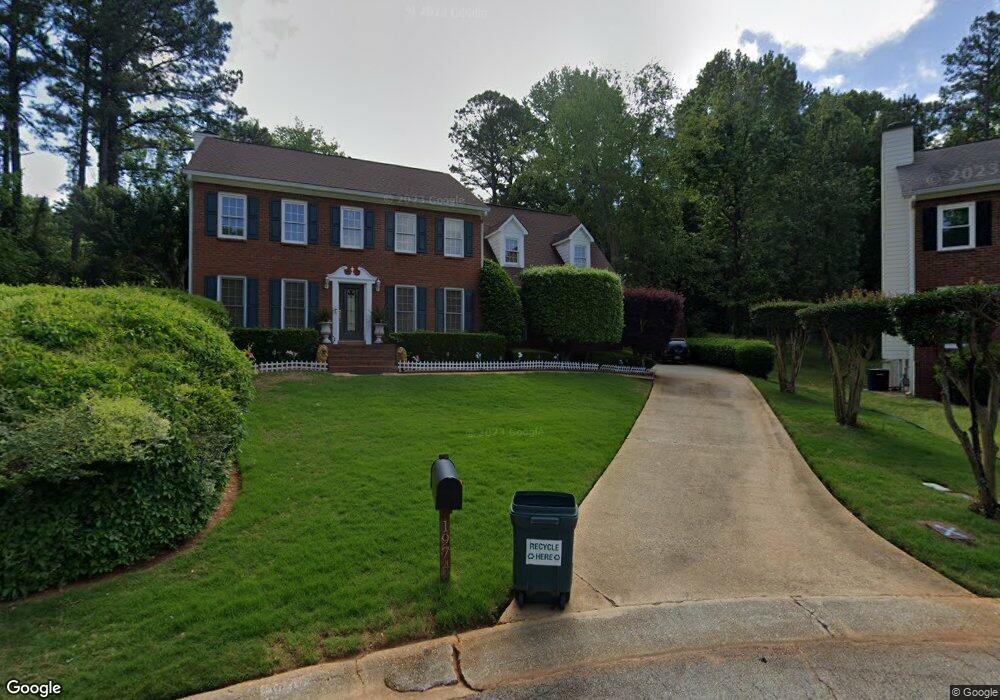
1974 Canfield Glen Unit 2 Lawrenceville, GA 30044
Gwinnett Place NeighborhoodEstimated Value: $388,000 - $399,000
4
Beds
3
Baths
2,338
Sq Ft
$169/Sq Ft
Est. Value
About This Home
This home is located at 1974 Canfield Glen Unit 2, Lawrenceville, GA 30044 and is currently estimated at $394,427, approximately $168 per square foot. 1974 Canfield Glen Unit 2 is a home located in Gwinnett County with nearby schools including Cedar Hill Elementary School, Richards Middle School, and Discovery High School.
Ownership History
Date
Name
Owned For
Owner Type
Purchase Details
Closed on
Jul 5, 2024
Sold by
Hysmith Carole F
Bought by
Hysmith Carole F and Hysmith Eric L
Current Estimated Value
Purchase Details
Closed on
Oct 30, 1998
Sold by
Guy Jeffrey and Guy Katherine
Bought by
Hysmith Carole F
Home Financials for this Owner
Home Financials are based on the most recent Mortgage that was taken out on this home.
Original Mortgage
$143,900
Interest Rate
6.58%
Mortgage Type
New Conventional
Purchase Details
Closed on
Dec 30, 1994
Sold by
Byard Donald Barbara
Bought by
Guy Jeffrey Katherine
Home Financials for this Owner
Home Financials are based on the most recent Mortgage that was taken out on this home.
Original Mortgage
$136,950
Interest Rate
9.26%
Create a Home Valuation Report for This Property
The Home Valuation Report is an in-depth analysis detailing your home's value as well as a comparison with similar homes in the area
Home Values in the Area
Average Home Value in this Area
Purchase History
| Date | Buyer | Sale Price | Title Company |
|---|---|---|---|
| Hysmith Carole F | -- | -- | |
| Hysmith Carole F | $179,900 | -- | |
| Guy Jeffrey Katherine | $152,200 | -- |
Source: Public Records
Mortgage History
| Date | Status | Borrower | Loan Amount |
|---|---|---|---|
| Previous Owner | Hysmith Carole F | $143,900 | |
| Previous Owner | Guy Jeffrey Katherine | $136,950 |
Source: Public Records
Tax History Compared to Growth
Tax History
| Year | Tax Paid | Tax Assessment Tax Assessment Total Assessment is a certain percentage of the fair market value that is determined by local assessors to be the total taxable value of land and additions on the property. | Land | Improvement |
|---|---|---|---|---|
| 2024 | $1,178 | $140,680 | $28,800 | $111,880 |
| 2023 | $1,178 | $138,440 | $31,200 | $107,240 |
| 2022 | $1,122 | $126,400 | $27,600 | $98,800 |
| 2021 | $1,111 | $94,400 | $19,600 | $74,800 |
| 2020 | $1,029 | $90,160 | $19,600 | $70,560 |
| 2019 | $1,029 | $80,480 | $17,200 | $63,280 |
| 2018 | $1,010 | $80,480 | $17,200 | $63,280 |
| 2016 | $1,049 | $68,760 | $14,400 | $54,360 |
| 2015 | $1,070 | $67,520 | $10,800 | $56,720 |
| 2014 | $922 | $53,080 | $10,800 | $42,280 |
Source: Public Records
Map
Nearby Homes
- 1805 Skidmore Cir
- 1941 Travers Cir
- 358 Patterson Rd
- 143 Patterson Rd
- 301 Congress Pkwy
- 421 Congress Pkwy
- 1902 Patterson Park Dr
- 1995 Plantation Rd
- 2065 Vanderbilt Place Unit 2
- 360 Senior Dr
- 1916 Patterson Cir
- 1850 Forkview Ct
- 1840 Forkview Ct
- 1849 Forkview Ct
- 1859 Forkview Ct
- 1820 Forkview Ct
- 1830 Forkview Ct
- 2001 Hunters Cove Dr
- 1849 Forkview Dr
- 411 Hunters Glen Ct
- 1984 Canfield Glen
- 253 Patterson Rd
- 1973 Canfield Glen
- 243 Patterson Rd Unit 3
- 263 Patterson Rd
- 318 Cottage Way
- 1880 Travers Cir
- 328 Cottage Way
- 1983 Canfield Glen
- 233 Patterson Rd
- 0 Canfield Glen
- 0 Patterson Rd SW Unit 8302509
- 0 Patterson Rd SW Unit 7376125
- 0 Patterson Rd SW Unit 7028732
- 0 Patterson Rd SW Unit 7483435
- 0 Patterson Rd SW Unit 7264351
- 0 Patterson Rd SW Unit 3257889
- 0 Patterson Rd SW Unit 3271410
- 0 Patterson Rd SW Unit 3270717
- 0 Patterson Rd SW Unit 3154937