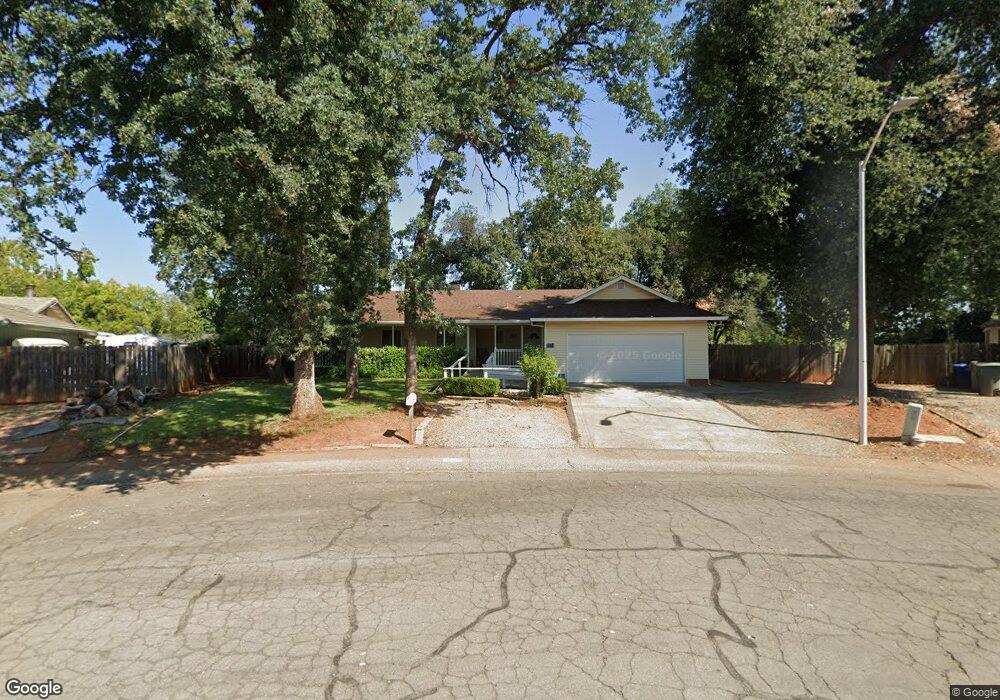
1974 Cirrus St Redding, CA 96002
Starview NeighborhoodEstimated Value: $365,000 - $396,000
4
Beds
2
Baths
1,846
Sq Ft
$208/Sq Ft
Est. Value
About This Home
This home is located at 1974 Cirrus St, Redding, CA 96002 and is currently estimated at $383,315, approximately $207 per square foot. 1974 Cirrus St is a home located in Shasta County with nearby schools including Alta Mesa Elementary School, Parsons Junior High School, and Enterprise High School.
Ownership History
Date
Name
Owned For
Owner Type
Purchase Details
Closed on
Apr 5, 2012
Sold by
Brenhaug Michael T and Brenhaug Susan A
Bought by
Emerson Dana and Emerson Kathleen Ann
Current Estimated Value
Home Financials for this Owner
Home Financials are based on the most recent Mortgage that was taken out on this home.
Original Mortgage
$90,071
Outstanding Balance
$62,213
Interest Rate
3.91%
Mortgage Type
Purchase Money Mortgage
Estimated Equity
$321,102
Purchase Details
Closed on
Nov 10, 2004
Sold by
Brenhaug Michael T and Brenhaug Susan A
Bought by
Brenhaug Michael T and Brenhaug Susan A
Purchase Details
Closed on
Jun 20, 2001
Sold by
Webster David F and Webster Brenda J
Bought by
Brenhaug Michael T and Brenhaug Susan A
Home Financials for this Owner
Home Financials are based on the most recent Mortgage that was taken out on this home.
Original Mortgage
$129,600
Interest Rate
7.15%
Create a Home Valuation Report for This Property
The Home Valuation Report is an in-depth analysis detailing your home's value as well as a comparison with similar homes in the area
Home Values in the Area
Average Home Value in this Area
Purchase History
| Date | Buyer | Sale Price | Title Company |
|---|---|---|---|
| Emerson Dana | $176,000 | Placer Title Company | |
| Brenhaug Michael T | -- | -- | |
| Brenhaug Michael T | $144,000 | First American Title Co |
Source: Public Records
Mortgage History
| Date | Status | Borrower | Loan Amount |
|---|---|---|---|
| Open | Emerson Dana | $90,071 | |
| Previous Owner | Brenhaug Michael T | $129,600 |
Source: Public Records
Tax History
| Year | Tax Paid | Tax Assessment Tax Assessment Total Assessment is a certain percentage of the fair market value that is determined by local assessors to be the total taxable value of land and additions on the property. | Land | Improvement |
|---|---|---|---|---|
| 2025 | $2,412 | $221,052 | $31,394 | $189,658 |
| 2024 | $2,378 | $216,719 | $30,779 | $185,940 |
| 2023 | $2,378 | $212,471 | $30,176 | $182,295 |
| 2022 | $2,311 | $208,306 | $29,585 | $178,721 |
| 2021 | $2,233 | $204,222 | $29,005 | $175,217 |
| 2020 | $2,223 | $202,129 | $28,708 | $173,421 |
| 2019 | $2,205 | $198,167 | $28,146 | $170,021 |
| 2018 | $2,180 | $194,283 | $27,595 | $166,688 |
| 2017 | $2,218 | $190,474 | $27,054 | $163,420 |
| 2016 | $2,075 | $186,740 | $26,524 | $160,216 |
| 2015 | $2,058 | $183,936 | $26,126 | $157,810 |
| 2014 | $2,044 | $180,334 | $25,615 | $154,719 |
Source: Public Records
Map
Nearby Homes
- 3732 Mercury Dr
- 3985 Cirrus St
- 1827 Bembow Dr
- 2068 Solar Way
- 4001 Alta Mesa Dr
- 2332 Venus Way
- 3528 Silverwood St
- 3466 Silverwood St
- 3778 Scorpius Way
- 3425 Silverwood St
- 3341 Timbercreek Dr
- 1922 Eddy Way
- 3688 Polaris Way
- 3594 Laramie St
- 1513 Harpole Rd
- 1959 Alexis Ct
- 3512 Capricorn Way
- 1397 Empress Ln
- 3759 Alma Ave
- 3293 Middleton Ln
- 3811 Cirrus St
- 1985 Bembow Dr
- 1967 Bembow Dr
- 3806 Mercury Dr
- 3775 Bembow Dr
- 3832 Mercury Dr
- 3843 Cirrus St
- 3794 Mercury Dr
- 1930 Cirrus St
- 1941 Bembow Dr
- 3844 Mercury Dr
- 1969 Cirrus St
- 3780 Mercury Dr
- 3865 Cirrus St
- 3858 Mercury Dr
- 1908 Cirrus St
- 1943 Cirrus St
- 10000 Dirus
- 3751 Bembow Dr
- 1915 Bembow Dr
Your Personal Tour Guide
Ask me questions while you tour the home.