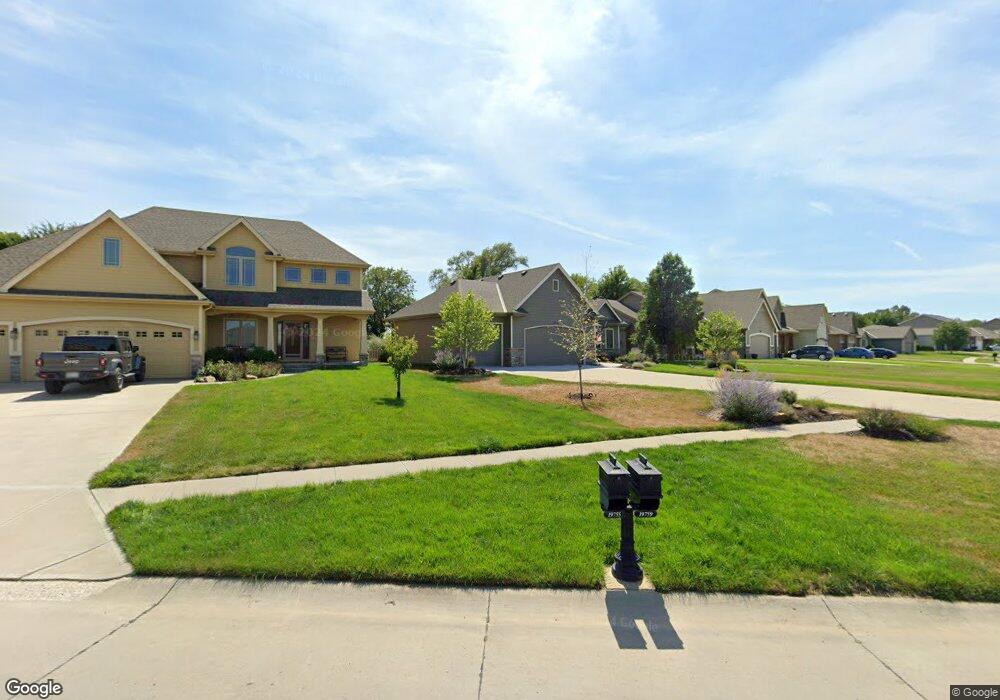
19759 Chandler St Gretna, NE 68028
Estimated Value: $440,000 - $466,000
4
Beds
3
Baths
2,477
Sq Ft
$182/Sq Ft
Est. Value
About This Home
This home is located at 19759 Chandler St, Gretna, NE 68028 and is currently estimated at $451,228, approximately $182 per square foot. 19759 Chandler St is a home located in Sarpy County with nearby schools including Reeder Elementary School, Beadle Middle School, and Millard West High School.
Ownership History
Date
Name
Owned For
Owner Type
Purchase Details
Closed on
Oct 17, 2008
Sold by
Langdon Allison K
Bought by
Langdon Christopher M
Current Estimated Value
Purchase Details
Closed on
Dec 27, 2006
Sold by
Good Life Homes Inc
Bought by
Langdon Christopher M and Langdon Allison K
Home Financials for this Owner
Home Financials are based on the most recent Mortgage that was taken out on this home.
Original Mortgage
$206,000
Interest Rate
6.2%
Purchase Details
Closed on
Feb 14, 2006
Sold by
Bellbrook Development Llc
Bought by
Good Life Homes Inc
Home Financials for this Owner
Home Financials are based on the most recent Mortgage that was taken out on this home.
Original Mortgage
$150,000
Interest Rate
6.05%
Mortgage Type
Small Business Administration
Create a Home Valuation Report for This Property
The Home Valuation Report is an in-depth analysis detailing your home's value as well as a comparison with similar homes in the area
Home Values in the Area
Average Home Value in this Area
Purchase History
| Date | Buyer | Sale Price | Title Company |
|---|---|---|---|
| Langdon Christopher M | -- | None Available | |
| Langdon Christopher M | $258,000 | Nlta | |
| Good Life Homes Inc | $32,000 | None Available |
Source: Public Records
Mortgage History
| Date | Status | Borrower | Loan Amount |
|---|---|---|---|
| Previous Owner | Langdon Christopher M | $206,000 | |
| Previous Owner | Good Life Homes Inc | $150,000 |
Source: Public Records
Tax History Compared to Growth
Tax History
| Year | Tax Paid | Tax Assessment Tax Assessment Total Assessment is a certain percentage of the fair market value that is determined by local assessors to be the total taxable value of land and additions on the property. | Land | Improvement |
|---|---|---|---|---|
| 2025 | $6,295 | $394,595 | $68,000 | $326,595 |
| 2024 | $6,847 | $381,701 | $68,000 | $313,701 |
| 2023 | $6,847 | $341,802 | $55,000 | $286,802 |
| 2022 | $6,682 | $309,733 | $50,000 | $259,733 |
| 2021 | $6,300 | $288,844 | $48,500 | $240,344 |
| 2020 | $6,389 | $285,685 | $48,500 | $237,185 |
| 2019 | $6,047 | $269,829 | $48,500 | $221,329 |
| 2018 | $6,135 | $263,960 | $39,000 | $224,960 |
| 2017 | $6,159 | $259,810 | $39,000 | $220,810 |
| 2016 | $6,135 | $257,280 | $37,000 | $220,280 |
| 2015 | $6,269 | $255,160 | $37,000 | $218,160 |
| 2014 | $6,358 | $248,030 | $37,000 | $211,030 |
| 2012 | -- | $237,615 | $33,000 | $204,615 |
Source: Public Records
Map
Nearby Homes
- 19823 Bellbrook Blvd
- 7710 S 198th St
- 19802 Cottonwood St
- 7712 S 199th St
- 19523 Josephine St
- 19821 Emiline St
- 19760 Briar St
- 8004 S 195th St
- 8008 S 200th St
- 8007 S 198th St
- 7819 S 194th Ave
- 8036 S 200th St
- 8044 S 200th St
- 8102 S 200th St
- 8125 S 198th Ave
- 8117 S 199th St
- 8114 S 199th St
- 19603 Brookside Ln
- 8137 S 197th Ave
- 8119 S 199th St
- 19753 Bellbrook Blvd
- 19755 Chandler St
- 19751 Chandler St
- 19757 Bellbrook Blvd
- 19744 Chandler St
- 19748 Chandler St
- 19761 Bellbrook Blvd
- 19747 Chandler St
- 19750 Bellbrook Blvd
- 19754 Bellbrook Blvd
- 19806 Redwood St
- 19802 Redwood St
- 19810 Redwood St
- 19746 Bellbrook Blvd
- 19743 Chandler St
- 19758 Bellbrook Blvd
- 19740 Chandler St
- 19739 Bellbrook Blvd
- 7701 S 198th St
- 7701 S 198th St Unit 158