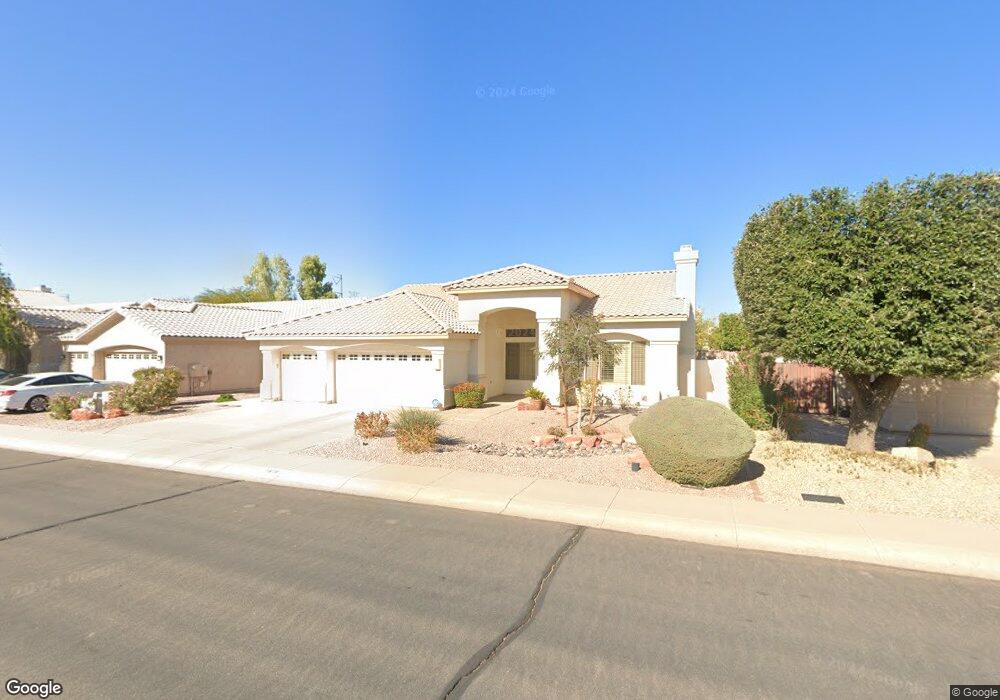
1976 E Dava Dr Tempe, AZ 85283
South Tempe NeighborhoodEstimated Value: $553,831 - $682,000
Studio
3
Baths
2,175
Sq Ft
$291/Sq Ft
Est. Value
About This Home
This home is located at 1976 E Dava Dr, Tempe, AZ 85283 and is currently estimated at $631,958, approximately $290 per square foot. 1976 E Dava Dr is a home located in Maricopa County with nearby schools including Kyrene de los Niños Elementary School, Kyrene del Norte School, and Kyrene Middle School.
Ownership History
Date
Name
Owned For
Owner Type
Purchase Details
Closed on
Jan 12, 2016
Sold by
Hubbell Brenda L and Nancy M Conrad Trust
Bought by
Hubbell Brenda L
Current Estimated Value
Purchase Details
Closed on
Apr 30, 2012
Sold by
Conrad Nancy M
Bought by
Conrad Nancy M and Nancy M Conrad Trust
Purchase Details
Closed on
Sep 18, 2002
Sold by
Wallace James D and Trzicky Richard F
Bought by
Conrad Nancy M
Home Financials for this Owner
Home Financials are based on the most recent Mortgage that was taken out on this home.
Original Mortgage
$179,925
Outstanding Balance
$74,777
Interest Rate
6.17%
Mortgage Type
New Conventional
Estimated Equity
$557,181
Purchase Details
Closed on
Dec 19, 1994
Sold by
Fulton Homes Corp
Bought by
Wallace James D and Trzicky Richard F
Home Financials for this Owner
Home Financials are based on the most recent Mortgage that was taken out on this home.
Original Mortgage
$165,400
Interest Rate
9.25%
Mortgage Type
New Conventional
Create a Home Valuation Report for This Property
The Home Valuation Report is an in-depth analysis detailing your home's value as well as a comparison with similar homes in the area
Home Values in the Area
Average Home Value in this Area
Purchase History
| Date | Buyer | Sale Price | Title Company |
|---|---|---|---|
| Hubbell Brenda L | -- | None Available | |
| Conrad Nancy M | -- | None Available | |
| Conrad Nancy M | $239,900 | Security Title Agency | |
| Wallace James D | $174,120 | Security Title Agency |
Source: Public Records
Mortgage History
| Date | Status | Borrower | Loan Amount |
|---|---|---|---|
| Open | Conrad Nancy M | $179,925 | |
| Previous Owner | Wallace James D | $165,400 |
Source: Public Records
Tax History
| Year | Tax Paid | Tax Assessment Tax Assessment Total Assessment is a certain percentage of the fair market value that is determined by local assessors to be the total taxable value of land and additions on the property. | Land | Improvement |
|---|---|---|---|---|
| 2025 | $3,532 | $37,799 | -- | -- |
| 2024 | $3,330 | $35,999 | -- | -- |
| 2023 | $3,330 | $47,030 | $9,400 | $37,630 |
| 2022 | $3,158 | $35,280 | $7,050 | $28,230 |
| 2021 | $3,281 | $32,710 | $6,540 | $26,170 |
| 2020 | $3,202 | $31,110 | $6,220 | $24,890 |
| 2019 | $3,101 | $29,850 | $5,970 | $23,880 |
| 2018 | $2,997 | $27,680 | $5,530 | $22,150 |
| 2017 | $2,873 | $26,910 | $5,380 | $21,530 |
| 2016 | $2,914 | $27,180 | $5,430 | $21,750 |
| 2015 | $2,691 | $24,800 | $4,960 | $19,840 |
Source: Public Records
Map
Nearby Homes
- 1943 E Diamond Dr
- 1938 E Diamond Dr
- 7116 S Los Feliz Dr
- 2031 E Vaughn St
- 2119 E Vaughn St
- 1861 E Krista Way
- 6411 S River Dr Unit 6
- 7715 S Alder Dr
- 1947 E Orion St
- 1919 E Velvet Dr
- 6815 S Juniper St
- 1914 E Citation Ln
- 6320 S Shannon Dr Unit 9
- 3229 N Desoto St
- 1915 E Gemini Dr Unit 6
- 6008 S Mcclintock Dr
- 2642 W Onza Ave
- 1338 E Sunburst Ln
- 2067 E Gemini Dr
- 8125 S Taylor Dr
- 1972 E Dava Dr
- 1980 E Dava Dr
- 1979 E Drake Dr
- 1975 E Drake Dr
- 1983 E Drake Dr
- 1968 E Dava Dr
- 1985 E Dava Dr
- 1981 E Dava Dr
- 1967 E Drake Dr
- 1989 E Dava Dr
- 1977 E Dava Dr
- 1964 E Dava Dr
- 1963 E Drake Dr
- 1973 E Dava Dr
- 1978 E Drake Dr
- 1982 E Stephens Dr
- 1974 E Drake Dr
- 1974 E Stephens Dr
- 1982 E Drake Dr
- 1969 E Dava Dr
Your Personal Tour Guide
Ask me questions while you tour the home.