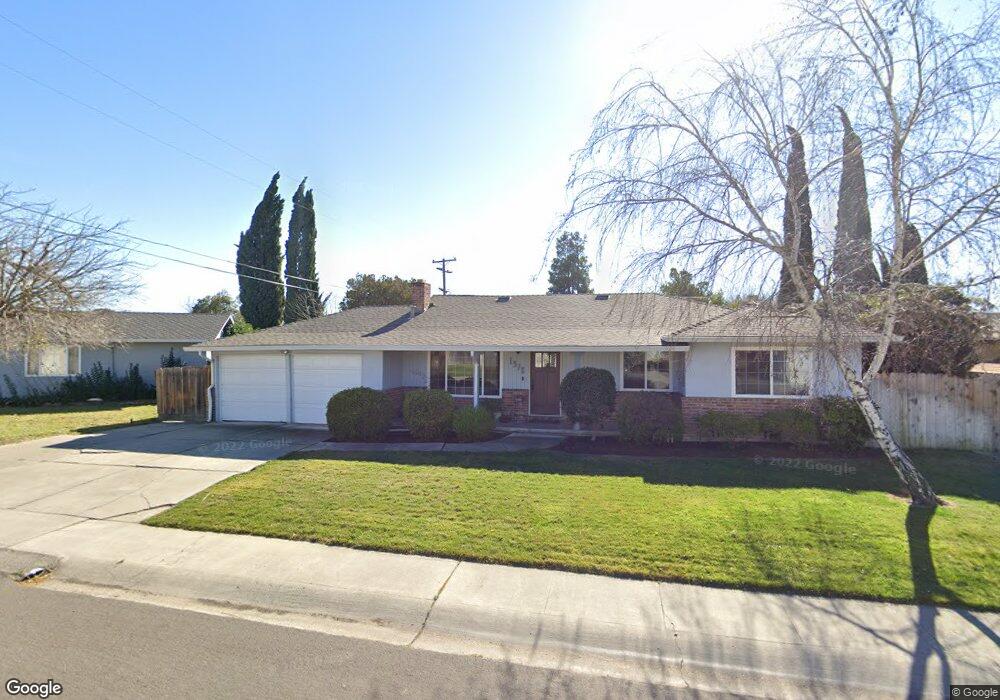
1976 San Luis Way Stockton, CA 95209
Colonial Heights NeighborhoodEstimated Value: $438,798 - $460,000
3
Beds
2
Baths
1,675
Sq Ft
$267/Sq Ft
Est. Value
About This Home
This home is located at 1976 San Luis Way, Stockton, CA 95209 and is currently estimated at $446,450, approximately $266 per square foot. 1976 San Luis Way is a home located in San Joaquin County with nearby schools including Colonial Heights School, Sierra Middle School, and Lincoln High School.
Ownership History
Date
Name
Owned For
Owner Type
Purchase Details
Closed on
Jun 28, 2018
Sold by
Clark James A and Clark Catherine A
Bought by
Clark James A and Clark Catherine A
Current Estimated Value
Home Financials for this Owner
Home Financials are based on the most recent Mortgage that was taken out on this home.
Original Mortgage
$170,000
Outstanding Balance
$147,330
Interest Rate
4.5%
Mortgage Type
New Conventional
Estimated Equity
$299,120
Purchase Details
Closed on
Apr 2, 2018
Sold by
Clark Catherine A
Bought by
Clark James A and Clark Catherine A
Purchase Details
Closed on
Jun 23, 1995
Sold by
Buntz Charles Gregory and Buntz Bonnie W
Bought by
Clark Catherine A
Home Financials for this Owner
Home Financials are based on the most recent Mortgage that was taken out on this home.
Original Mortgage
$116,667
Interest Rate
7.88%
Mortgage Type
FHA
Create a Home Valuation Report for This Property
The Home Valuation Report is an in-depth analysis detailing your home's value as well as a comparison with similar homes in the area
Home Values in the Area
Average Home Value in this Area
Purchase History
| Date | Buyer | Sale Price | Title Company |
|---|---|---|---|
| Clark James A | -- | None Available | |
| Clark James A | -- | None Available | |
| Clark Catherine A | $117,500 | Alliance Title Co |
Source: Public Records
Mortgage History
| Date | Status | Borrower | Loan Amount |
|---|---|---|---|
| Open | Clark James A | $170,000 | |
| Closed | Clark Catherine A | $116,667 |
Source: Public Records
Tax History Compared to Growth
Tax History
| Year | Tax Paid | Tax Assessment Tax Assessment Total Assessment is a certain percentage of the fair market value that is determined by local assessors to be the total taxable value of land and additions on the property. | Land | Improvement |
|---|---|---|---|---|
| 2025 | $4,485 | $197,336 | $58,779 | $138,557 |
| 2024 | $4,389 | $193,468 | $57,627 | $135,841 |
| 2023 | $4,322 | $189,676 | $56,498 | $133,178 |
| 2022 | $4,190 | $185,958 | $55,391 | $130,567 |
| 2021 | $4,115 | $182,312 | $54,305 | $128,007 |
| 2020 | $4,071 | $180,444 | $53,749 | $126,695 |
| 2019 | $4,037 | $176,907 | $52,696 | $124,211 |
| 2018 | $3,942 | $173,439 | $51,663 | $121,776 |
| 2017 | $3,865 | $170,039 | $50,650 | $119,389 |
| 2016 | $3,564 | $166,706 | $49,657 | $117,049 |
| 2014 | $3,619 | $160,985 | $47,953 | $113,032 |
Source: Public Records
Map
Nearby Homes
- 8347 San Pablo Way
- 2019 San Gabriel Way
- 2112 Portola Ave
- 1816 Cortez Ave
- 1629 Cortez Ave
- 2454 Golden Bear Cir
- 2417 Segarini Way
- 8811 Davis Rd
- 8011 N Pershing Ave
- 1235 Briarwood Way
- 2640 Javete Way
- 7724 Peppertree Dr Unit 10
- 8324 Rothesay Place
- 1418 Woodcreek Way
- 8518 Burns Place
- 7523 Oakcreek Dr
- 8419 Macduff Ct
- 9409 Carter Ct
- 7512 Heather Dr
- 8160 Encino Ave
- 2008 San Luis Way
- 8431 San Pablo Way
- 1975 Santa Rosa Way
- 2007 Santa Rosa Way
- 8415 San Pablo Way
- 2020 San Luis Way
- 1975 San Luis Way
- 2007 San Luis Way
- 8459 San Pablo Way
- 2032 San Luis Way
- 2021 San Luis Way
- 8434 San Pablo Way
- 8422 San Pablo Way
- 2031 Santa Rosa Way
- 8446 San Pablo Way
- 1935 Santa Rosa Way
- 2033 San Luis Way
- 8458 San Pablo Way
- 1976 Portola Ave
- 2006 Santa Rosa Way